

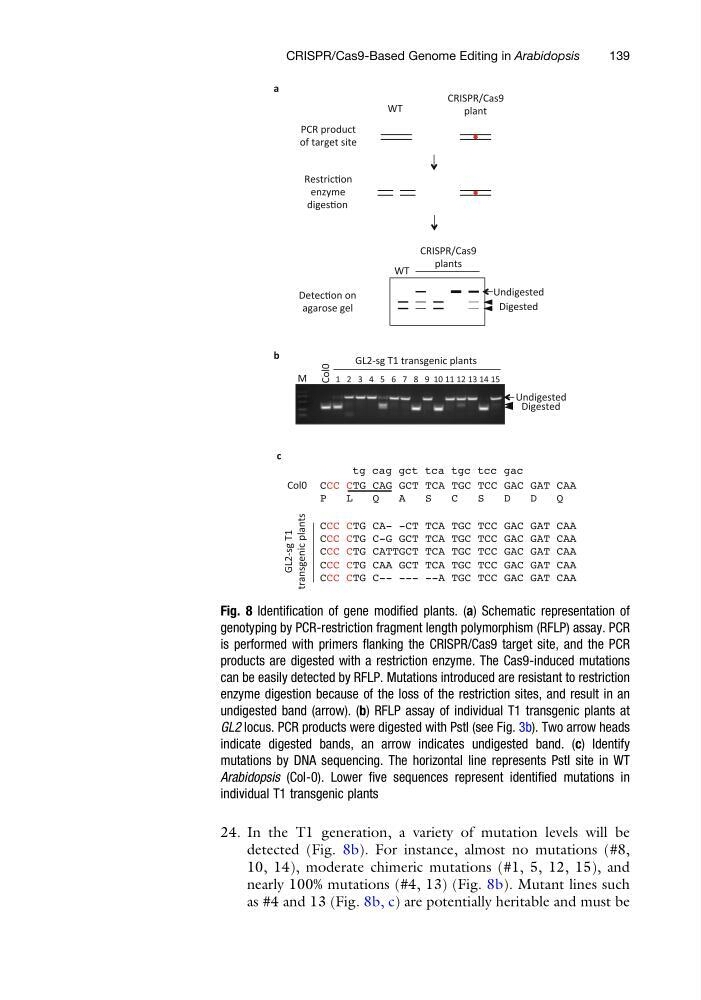
24. In the T1 generation, a variety of mutation levels will be
detected (Fig. 8b). For instance, almost no mutations (#8,
10, 14), moderate chimeric mutations (#1, 5, 12, 15), and
nearly 100% mutations (#4, 13) (Fig. 8b). Mutant lines such
as #4 and 13 (Fig. 8b, c) are potentially heritable and must be
Fig. 8 Identification of gene modified plants. (a) Schematic representation of
genotyping by PCR-restriction fragment length polymorphism (RFLP) assay. PCR
is performed with primers flanking the CRISPR/Cas9 target site, and the PCR
products are digested with a restriction enzyme. The Cas9-induced mutations
can be easily detected by RFLP. Mutations introduced are resistant to restriction
enzyme digestion because of the loss of the restriction sites, and result in an
undigested band (arrow). (b) RFLP assay of individual T1 transgenic plants at
GL2 locus. PCR products were digested with PstI (see Fig. 3b). Two arrow heads
indicate digested bands, an arrow indicates undigested band. (c) Identify
mutations by DNA sequencing. The horizontal line represents PstI site in WT
Arabidopsis (Col-0). Lower five sequences represent identified mutations in
individual T1 transgenic plants
CRISPR/Cas9-Based Genome Editing in Arabidopsis
139
detected (Fig. 8b). For instance, almost no mutations (#8,
10, 14), moderate chimeric mutations (#1, 5, 12, 15), and
nearly 100% mutations (#4, 13) (Fig. 8b). Mutant lines such
as #4 and 13 (Fig. 8b, c) are potentially heritable and must be
Fig. 8 Identification of gene modified plants. (a) Schematic representation of
genotyping by PCR-restriction fragment length polymorphism (RFLP) assay. PCR
is performed with primers flanking the CRISPR/Cas9 target site, and the PCR
products are digested with a restriction enzyme. The Cas9-induced mutations
can be easily detected by RFLP. Mutations introduced are resistant to restriction
enzyme digestion because of the loss of the restriction sites, and result in an
undigested band (arrow). (b) RFLP assay of individual T1 transgenic plants at
GL2 locus. PCR products were digested with PstI (see Fig. 3b). Two arrow heads
indicate digested bands, an arrow indicates undigested band. (c) Identify
mutations by DNA sequencing. The horizontal line represents PstI site in WT
Arabidopsis (Col-0). Lower five sequences represent identified mutations in
individual T1 transgenic plants
CRISPR/Cas9-Based Genome Editing in Arabidopsis
139