

4.1 The Global Setting of Biofuel Expansion
69
US ethanol
US biodiesel
Brazil ethanol
Brazil biodiesel
EU ethanol
EU biodiesel
Others ethanol
Others biodiesel
0
20
40
60
80
100
120
140
160
180
2005
2008
2011
2015
2018
Biofuel producƟon in billion liters
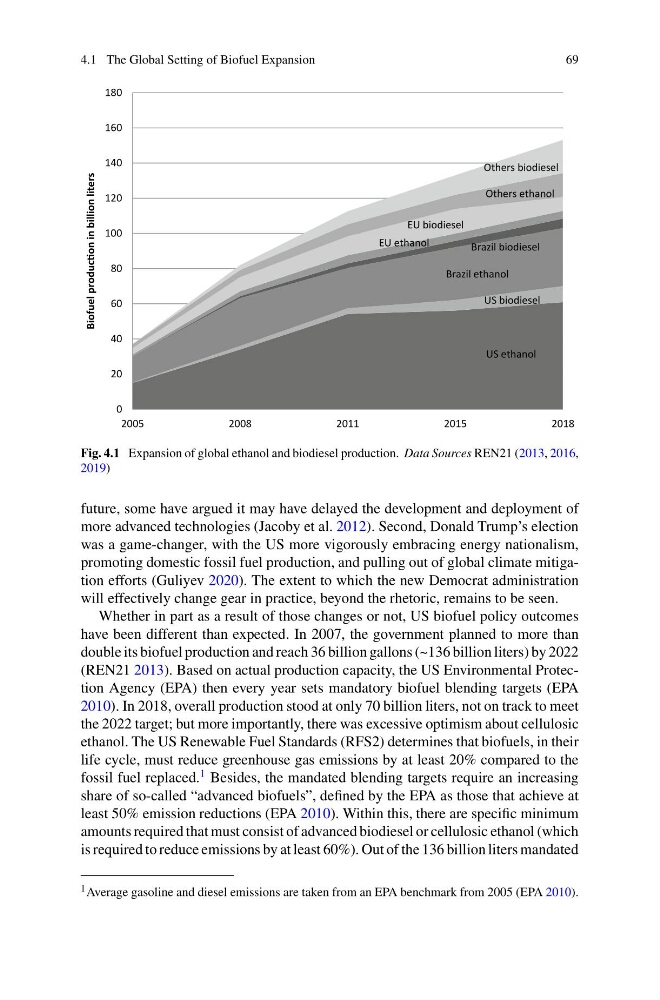
Fig. 4.1 Expansion of global ethanol and biodiesel production. Data Sources REN21 (2013, 2016,
2019)
future, some have argued it may have delayed the development and deployment of
more advanced technologies (Jacoby et al. 2012). Second, Donald Trump’s election
was a game-changer, with the US more vigorously embracing energy nationalism,
promoting domestic fossil fuel production, and pulling out of global climate mitigation efforts (Guliyev 2020). The extent to which the new Democrat administration
will effectively change gear in practice, beyond the rhetoric, remains to be seen.
Whether in part as a result of those changes or not, US biofuel policy outcomes
have been different than expected. In 2007, the government planned to more than
double its biofuel production and reach 36 billion gallons (~136 billion liters) by 2022
(REN21 2013). Based on actual production capacity, the US Environmental Protection Agency (EPA) then every year sets mandatory biofuel blending targets (EPA
2010). In 2018, overall production stood at only 70 billion liters, not on track to meet
the 2022 target; but more importantly, there was excessive optimism about cellulosic
ethanol. The US Renewable Fuel Standards (RFS2) determines that biofuels, in their
life cycle, must reduce greenhouse gas emissions by at least 20% compared to the
fossil fuel replaced.
1 Besides, the mandated blending targets require an increasing
share of so-called “advanced biofuels”, defined by the EPA as those that achieve at
least 50% emission reductions (EPA 2010). Within this, there are specific minimum
amounts required that must consist of advanced biodiesel or cellulosic ethanol (which
is required to reduce emissions by at least 60%). Out of the 136 billion liters mandated
1 Average gasoline and diesel emissions are taken from an EPA benchmark from 2005 (EPA 2010).
69
US ethanol
US biodiesel
Brazil ethanol
Brazil biodiesel
EU ethanol
EU biodiesel
Others ethanol
Others biodiesel
0
20
40
60
80
100
120
140
160
180
2005
2008
2011
2015
2018
Biofuel producƟon in billion liters
Fig. 4.1 Expansion of global ethanol and biodiesel production. Data Sources REN21 (2013, 2016,
2019)
future, some have argued it may have delayed the development and deployment of
more advanced technologies (Jacoby et al. 2012). Second, Donald Trump’s election
was a game-changer, with the US more vigorously embracing energy nationalism,
promoting domestic fossil fuel production, and pulling out of global climate mitigation efforts (Guliyev 2020). The extent to which the new Democrat administration
will effectively change gear in practice, beyond the rhetoric, remains to be seen.
Whether in part as a result of those changes or not, US biofuel policy outcomes
have been different than expected. In 2007, the government planned to more than
double its biofuel production and reach 36 billion gallons (~136 billion liters) by 2022
(REN21 2013). Based on actual production capacity, the US Environmental Protection Agency (EPA) then every year sets mandatory biofuel blending targets (EPA
2010). In 2018, overall production stood at only 70 billion liters, not on track to meet
the 2022 target; but more importantly, there was excessive optimism about cellulosic
ethanol. The US Renewable Fuel Standards (RFS2) determines that biofuels, in their
life cycle, must reduce greenhouse gas emissions by at least 20% compared to the
fossil fuel replaced.
1 Besides, the mandated blending targets require an increasing
share of so-called “advanced biofuels”, defined by the EPA as those that achieve at
least 50% emission reductions (EPA 2010). Within this, there are specific minimum
amounts required that must consist of advanced biodiesel or cellulosic ethanol (which
is required to reduce emissions by at least 60%). Out of the 136 billion liters mandated
1 Average gasoline and diesel emissions are taken from an EPA benchmark from 2005 (EPA 2010).