

14
1 Introduction: Political Dimensions …
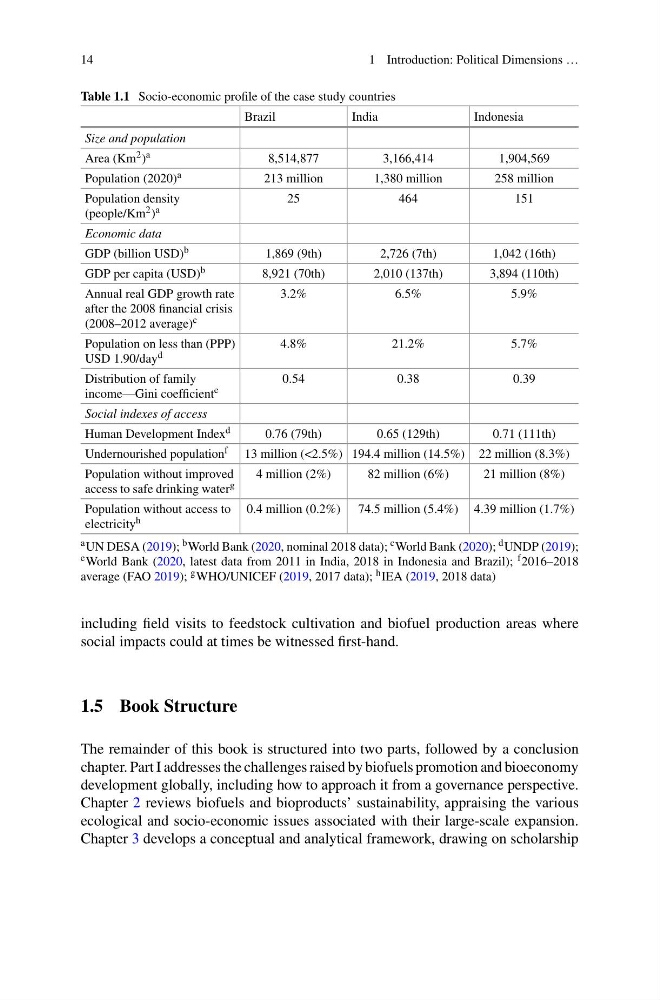
Table 1.1 Socio-economic profile of the case study countries
Brazil
India
Indonesia
Size and population
Area (Km 2 ) a
8,514,877
3,166,414
1,904,569
Population (2020) a
213 million
1,380 million
258 million
Population density
(people/Km 2 ) a
25
464
151
Economic data
GDP (billion USD) b
1,869 (9th)
2,726 (7th)
1,042 (16th)
GDP per capita (USD) b
8,921 (70th)
2,010 (137th)
3,894 (110th)
Annual real GDP growth rate
after the 2008 financial crisis
(2008–2012 average) c
3.2%
6.5%
5.9%
Population on less than (PPP)
USD 1.90/day d
4.8%
21.2%
5.7%
Distribution of family
income—Gini coefficient e
0.54
0.38
0.39
Social indexes of access
Human Development Index d
0.76 (79th)
0.65 (129th)
0.71 (111th)
Undernourished population f 13 million (<2.5%) 194.4 million (14.5%) 22 million (8.3%)
Population without improved
access to safe drinking water g
4 million (2%)
82 million (6%)
21 million (8%)
Population without access to
electricity h
0.4 million (0.2%) 74.5 million (5.4%) 4.39 million (1.7%)
a UN DESA (2019); b World Bank (2020, nominal 2018 data); c World Bank (2020); d UNDP (2019);
e World Bank (2020, latest data from 2011 in India, 2018 in Indonesia and Brazil); f 2016–2018
average (FAO 2019); g WHO/UNICEF (2019, 2017 data); h IEA (2019, 2018 data)
including field visits to feedstock cultivation and biofuel production areas where
social impacts could at times be witnessed first-hand.
1.5 Book Structure
The remainder of this book is structured into two parts, followed by a conclusion
chapter. Part I addresses the challenges raised by biofuels promotion and bioeconomy
development globally, including how to approach it from a governance perspective.
Chapter 2 reviews biofuels and bioproducts’ sustainability, appraising the various
ecological and socio-economic issues associated with their large-scale expansion.
Chapter 3 develops a conceptual and analytical framework, drawing on scholarship
1 Introduction: Political Dimensions …
Table 1.1 Socio-economic profile of the case study countries
Brazil
India
Indonesia
Size and population
Area (Km 2 ) a
8,514,877
3,166,414
1,904,569
Population (2020) a
213 million
1,380 million
258 million
Population density
(people/Km 2 ) a
25
464
151
Economic data
GDP (billion USD) b
1,869 (9th)
2,726 (7th)
1,042 (16th)
GDP per capita (USD) b
8,921 (70th)
2,010 (137th)
3,894 (110th)
Annual real GDP growth rate
after the 2008 financial crisis
(2008–2012 average) c
3.2%
6.5%
5.9%
Population on less than (PPP)
USD 1.90/day d
4.8%
21.2%
5.7%
Distribution of family
income—Gini coefficient e
0.54
0.38
0.39
Social indexes of access
Human Development Index d
0.76 (79th)
0.65 (129th)
0.71 (111th)
Undernourished population f 13 million (<2.5%) 194.4 million (14.5%) 22 million (8.3%)
Population without improved
access to safe drinking water g
4 million (2%)
82 million (6%)
21 million (8%)
Population without access to
electricity h
0.4 million (0.2%) 74.5 million (5.4%) 4.39 million (1.7%)
a UN DESA (2019); b World Bank (2020, nominal 2018 data); c World Bank (2020); d UNDP (2019);
e World Bank (2020, latest data from 2011 in India, 2018 in Indonesia and Brazil); f 2016–2018
average (FAO 2019); g WHO/UNICEF (2019, 2017 data); h IEA (2019, 2018 data)
including field visits to feedstock cultivation and biofuel production areas where
social impacts could at times be witnessed first-hand.
1.5 Book Structure
The remainder of this book is structured into two parts, followed by a conclusion
chapter. Part I addresses the challenges raised by biofuels promotion and bioeconomy
development globally, including how to approach it from a governance perspective.
Chapter 2 reviews biofuels and bioproducts’ sustainability, appraising the various
ecological and socio-economic issues associated with their large-scale expansion.
Chapter 3 develops a conceptual and analytical framework, drawing on scholarship