

The first study that reported the abundance of floating plastic debris in the
Mediterranean Sea was conducted by Morris (1980), who determined a concentration of about 1300 items per km
2 near Malta. A similar study was conducted later by
Turner and Holmes (2011), who reported a concentration of 1000 items per m
2 in the
Maltese beaches. The average plastic concentration in Mediterranean surface waters
is 243,853 items per km
2 (Cózar et al. 2015). This concentration is much lower in the
water column, where a limited number of studies have reported low concentrations
of microplastics (Cincinelli et al. 2019; Fossi et al. 2012; Xiong et al. 2018).
Figure 1.13 represents a map of Asia with the main accumulations of microplastic
debris. The most contaminated areas are, as in Europe, the estuaries of the rivers
Yangtze, Nakdong, and Pearl, where quantities of 4137 items per m
3 in water,
27,606 items per m
2 in sediments, and 5959 items per m
2 in sediments were
estimated, respectively (Fok and Cheung 2015; Lee et al. 2013; Zhao et al. 2014).
Compared to European marine ecosystems, Asia is much more contaminated with
microplastics. China is the third major producer of plastic waste in the world
(Plastics Europe 2018). Therefore, it is not surprising that their coastlines are so
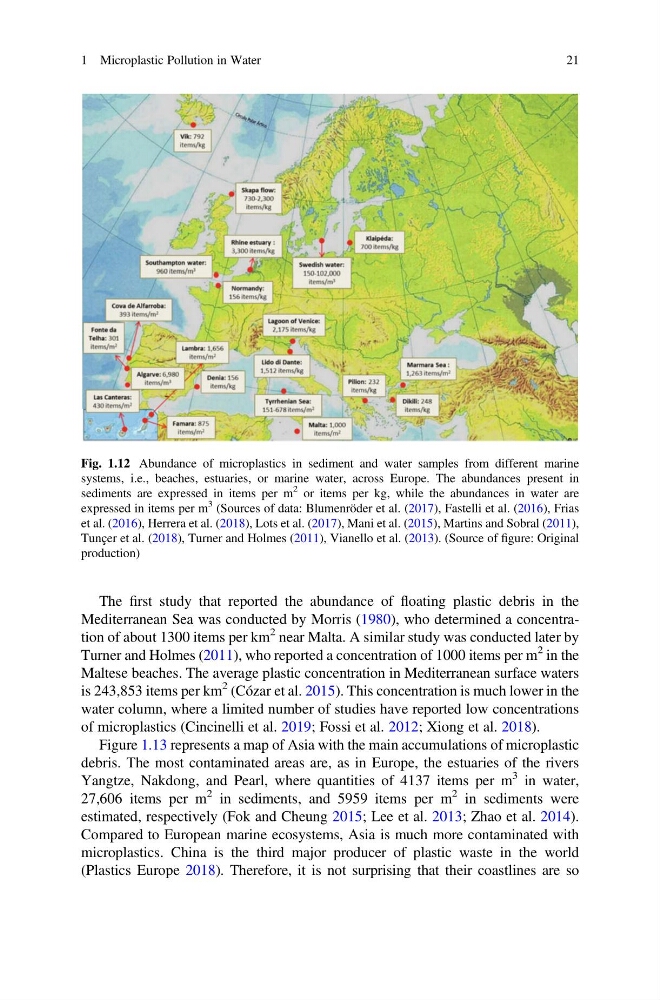
Fig. 1.12 Abundance of microplastics in sediment and water samples from different marine
systems, i.e., beaches, estuaries, or marine water, across Europe. The abundances present in
sediments are expressed in items per m
2 or items per kg, while the abundances in water are
expressed in items per m
3 (Sources of data: Blumenröder et al. (2017), Fastelli et al. (2016), Frias
et al. (2016), Herrera et al. (2018), Lots et al. (2017), Mani et al. (2015), Martins and Sobral (2011),
Tunçer et al. (2018), Turner and Holmes (2011), Vianello et al. (2013). (Source of figure: Original
production)
1 Microplastic Pollution in Water
21
Mediterranean Sea was conducted by Morris (1980), who determined a concentration of about 1300 items per km
2 near Malta. A similar study was conducted later by
Turner and Holmes (2011), who reported a concentration of 1000 items per m
2 in the
Maltese beaches. The average plastic concentration in Mediterranean surface waters
is 243,853 items per km
2 (Cózar et al. 2015). This concentration is much lower in the
water column, where a limited number of studies have reported low concentrations
of microplastics (Cincinelli et al. 2019; Fossi et al. 2012; Xiong et al. 2018).
Figure 1.13 represents a map of Asia with the main accumulations of microplastic
debris. The most contaminated areas are, as in Europe, the estuaries of the rivers
Yangtze, Nakdong, and Pearl, where quantities of 4137 items per m
3 in water,
27,606 items per m
2 in sediments, and 5959 items per m
2 in sediments were
estimated, respectively (Fok and Cheung 2015; Lee et al. 2013; Zhao et al. 2014).
Compared to European marine ecosystems, Asia is much more contaminated with
microplastics. China is the third major producer of plastic waste in the world
(Plastics Europe 2018). Therefore, it is not surprising that their coastlines are so
Fig. 1.12 Abundance of microplastics in sediment and water samples from different marine
systems, i.e., beaches, estuaries, or marine water, across Europe. The abundances present in
sediments are expressed in items per m
2 or items per kg, while the abundances in water are
expressed in items per m
3 (Sources of data: Blumenröder et al. (2017), Fastelli et al. (2016), Frias
et al. (2016), Herrera et al. (2018), Lots et al. (2017), Mani et al. (2015), Martins and Sobral (2011),
Tunçer et al. (2018), Turner and Holmes (2011), Vianello et al. (2013). (Source of figure: Original
production)
1 Microplastic Pollution in Water
21