

in Asia, Africa, Europe, and North America, in order to determine their geographical
distribution. This information is presented in Figs. 1.5, 1.6, 1.7, and 1.8.
The samples found in rivers and lakes mainly from freshwater sources contain a
large amount of microplastics, which is then reflected in the amount of microplastics
found in the seas and oceans, as rivers are one of the main transport routes. Based on
the sediment typology, it can be observed how in Europe, in Sweden (Lysekil), 8360
items per kg were found (Magnusson and Noren 2014), while in North America, in
Canada (St. Lawrence River), 13,832 items per m
2 were found (Castañeda et al.
2014). On the other hand, with focus on the microplastics found in water samples,
the highest concentrations are found in North America. In the United States (Los
Angeles River), 12,932 items per m
3 were obtained (Moore et al. 2011), while in
Chicago River 6.69E6 items per m
2 were obtained (McCormick et al. 2014).
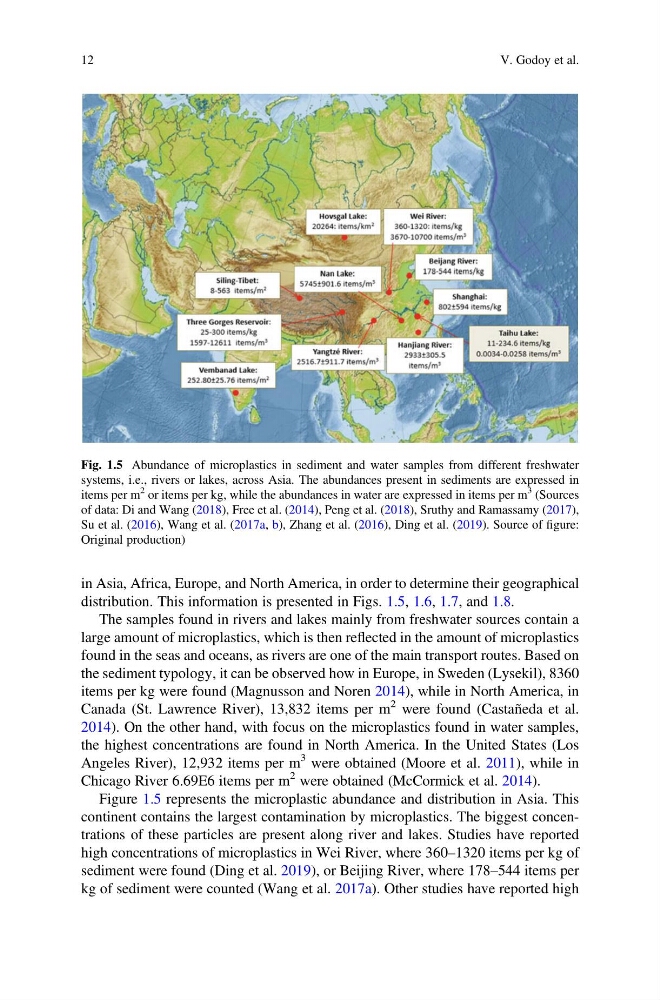
Figure 1.5 represents the microplastic abundance and distribution in Asia. This
continent contains the largest contamination by microplastics. The biggest concentrations of these particles are present along river and lakes. Studies have reported
high concentrations of microplastics in Wei River, where 360–1320 items per kg of
sediment were found (Ding et al. 2019), or Beijing River, where 178–544 items per
kg of sediment were counted (Wang et al. 2017a). Other studies have reported high
Fig. 1.5 Abundance of microplastics in sediment and water samples from different freshwater
systems, i.e., rivers or lakes, across Asia. The abundances present in sediments are expressed in
items per m
2 or items per kg, while the abundances in water are expressed in items per m
3 (Sources
of data: Di and Wang (2018), Free et al. (2014), Peng et al. (2018), Sruthy and Ramassamy (2017),
Su et al. (2016), Wang et al. (2017a, b), Zhang et al. (2016), Ding et al. (2019). Source of figure:
Original production)
12
V. Godoy et al.
distribution. This information is presented in Figs. 1.5, 1.6, 1.7, and 1.8.
The samples found in rivers and lakes mainly from freshwater sources contain a
large amount of microplastics, which is then reflected in the amount of microplastics
found in the seas and oceans, as rivers are one of the main transport routes. Based on
the sediment typology, it can be observed how in Europe, in Sweden (Lysekil), 8360
items per kg were found (Magnusson and Noren 2014), while in North America, in
Canada (St. Lawrence River), 13,832 items per m
2 were found (Castañeda et al.
2014). On the other hand, with focus on the microplastics found in water samples,
the highest concentrations are found in North America. In the United States (Los
Angeles River), 12,932 items per m
3 were obtained (Moore et al. 2011), while in
Chicago River 6.69E6 items per m
2 were obtained (McCormick et al. 2014).
Figure 1.5 represents the microplastic abundance and distribution in Asia. This
continent contains the largest contamination by microplastics. The biggest concentrations of these particles are present along river and lakes. Studies have reported
high concentrations of microplastics in Wei River, where 360–1320 items per kg of
sediment were found (Ding et al. 2019), or Beijing River, where 178–544 items per
kg of sediment were counted (Wang et al. 2017a). Other studies have reported high
Fig. 1.5 Abundance of microplastics in sediment and water samples from different freshwater
systems, i.e., rivers or lakes, across Asia. The abundances present in sediments are expressed in
items per m
2 or items per kg, while the abundances in water are expressed in items per m
3 (Sources
of data: Di and Wang (2018), Free et al. (2014), Peng et al. (2018), Sruthy and Ramassamy (2017),
Su et al. (2016), Wang et al. (2017a, b), Zhang et al. (2016), Ding et al. (2019). Source of figure:
Original production)
12
V. Godoy et al.