

and 3.4), proteins co-purified with dsRNA should be purified
and analyzed by Western blot. Start with the phenolic phase
obtained after TRIzol/chloroform extraction of the beads (see
Subheading 3.2, step 2). Place 300 μL of this phenolic phase
into a new 1.5 mL tube. Add 4–5 volumes of ice-cold acetone,
mix by inversion, and incubate overnight at À20
C. Centrifuge at 4
C for 30 min at 16,000 Â g and remove the supernatant, paying attention not to discard the small red pellet. Add
400 μL ice-cold 80% acetone, centrifuge for 5 min at
16,000 Â g, remove supernatant, and allow the pellet to dry.
Resuspend the pellet in 30 μL protein resuspension buffer, add
10 μL protein-loading buffer, vortex, and denature as
described in Subheading 3.5, step 1. The sample may be stored
at À20
C.
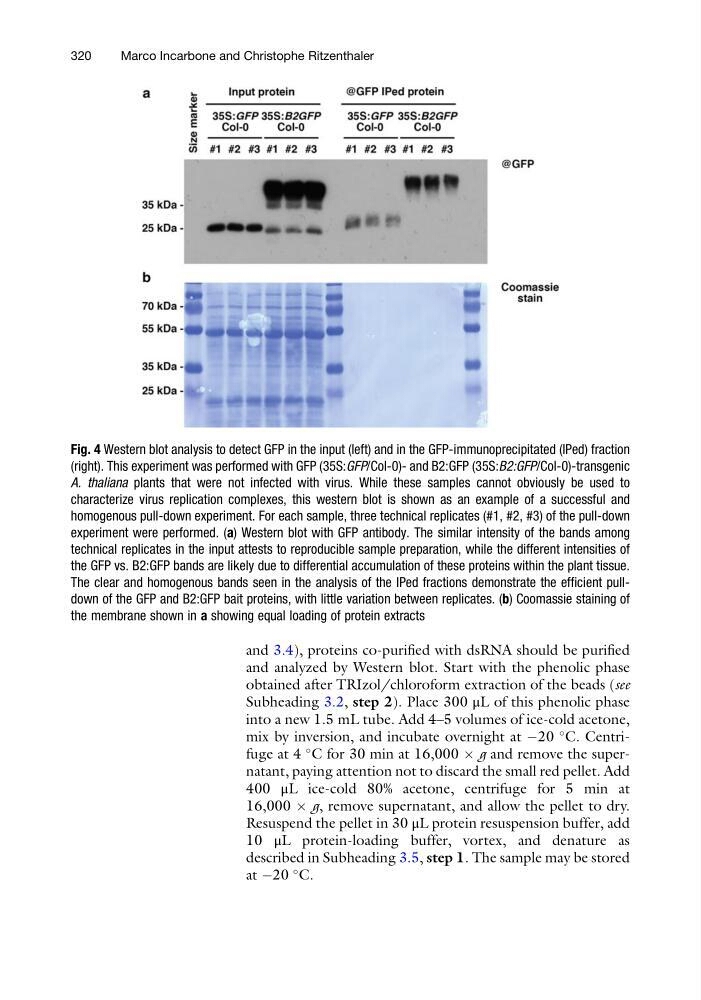
Fig. 4 Western blot analysis to detect GFP in the input (left) and in the GFP-immunoprecipitated (IPed) fraction
(right). This experiment was performed with GFP (35S:GFP/Col-0)- and B2:GFP (35S:B2:GFP/Col-0)-transgenic
A. thaliana plants that were not infected with virus. While these samples cannot obviously be used to
characterize virus replication complexes, this western blot is shown as an example of a successful and
homogenous pull-down experiment. For each sample, three technical replicates (#1, #2, #3) of the pull-down
experiment were performed. (a) Western blot with GFP antibody. The similar intensity of the bands among
technical replicates in the input attests to reproducible sample preparation, while the different intensities of
the GFP vs. B2:GFP bands are likely due to differential accumulation of these proteins within the plant tissue.
The clear and homogenous bands seen in the analysis of the IPed fractions demonstrate the efficient pulldown of the GFP and B2:GFP bait proteins, with little variation between replicates. (b) Coomassie staining of
the membrane shown in a showing equal loading of protein extracts
320
Marco Incarbone and Christophe Ritzenthaler
and analyzed by Western blot. Start with the phenolic phase
obtained after TRIzol/chloroform extraction of the beads (see
Subheading 3.2, step 2). Place 300 μL of this phenolic phase
into a new 1.5 mL tube. Add 4–5 volumes of ice-cold acetone,
mix by inversion, and incubate overnight at À20
C. Centrifuge at 4
C for 30 min at 16,000 Â g and remove the supernatant, paying attention not to discard the small red pellet. Add
400 μL ice-cold 80% acetone, centrifuge for 5 min at
16,000 Â g, remove supernatant, and allow the pellet to dry.
Resuspend the pellet in 30 μL protein resuspension buffer, add
10 μL protein-loading buffer, vortex, and denature as
described in Subheading 3.5, step 1. The sample may be stored
at À20
C.
Fig. 4 Western blot analysis to detect GFP in the input (left) and in the GFP-immunoprecipitated (IPed) fraction
(right). This experiment was performed with GFP (35S:GFP/Col-0)- and B2:GFP (35S:B2:GFP/Col-0)-transgenic
A. thaliana plants that were not infected with virus. While these samples cannot obviously be used to
characterize virus replication complexes, this western blot is shown as an example of a successful and
homogenous pull-down experiment. For each sample, three technical replicates (#1, #2, #3) of the pull-down
experiment were performed. (a) Western blot with GFP antibody. The similar intensity of the bands among
technical replicates in the input attests to reproducible sample preparation, while the different intensities of
the GFP vs. B2:GFP bands are likely due to differential accumulation of these proteins within the plant tissue.
The clear and homogenous bands seen in the analysis of the IPed fractions demonstrate the efficient pulldown of the GFP and B2:GFP bait proteins, with little variation between replicates. (b) Coomassie staining of
the membrane shown in a showing equal loading of protein extracts
320
Marco Incarbone and Christophe Ritzenthaler