

3. Incubate samples in the dark at 37
C until a red staining is
visible (initially check every 10 min; afterwards the periods can
be extended).
4. Stop the reaction by washing the samples four times with
PBS-T (see Note 22).
5. For light microscopy, the roots are transferred and separated in
a drop of 77% (v/v) glycerol/PBS on a glass slide using a
tweezer and cannulas.
6. For fluorescent microscopy the roots are transferred and separated in a drop of DAPI-containing anti-fading mounting
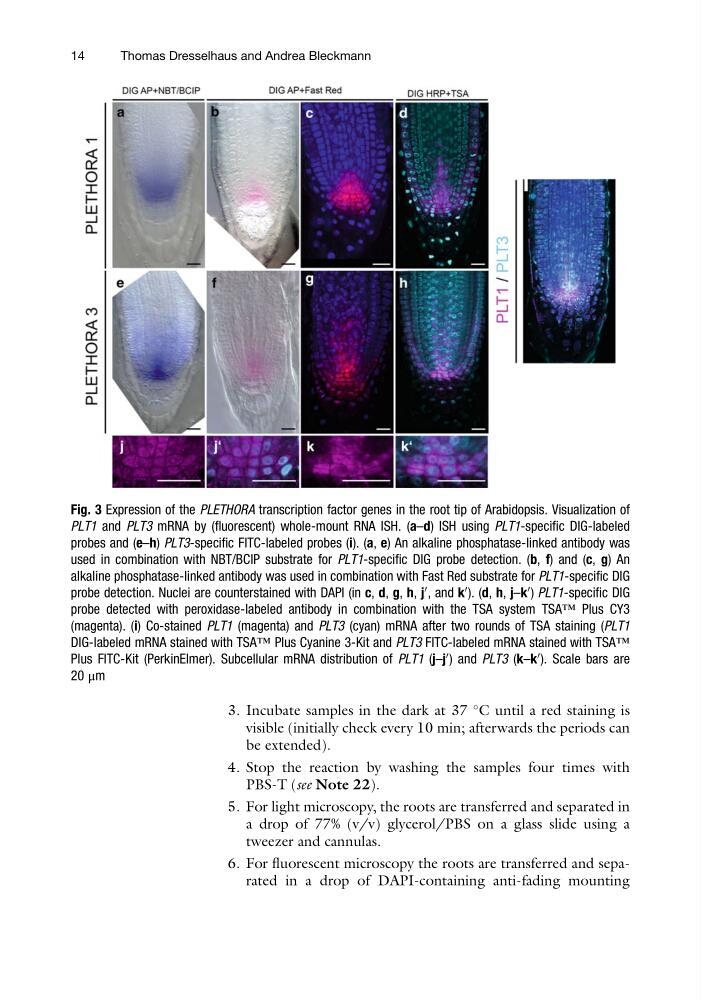
Fig. 3 Expression of the PLETHORA transcription factor genes in the root tip of Arabidopsis. Visualization of
PLT1 and PLT3 mRNA by (fluorescent) whole-mount RNA ISH. (a–d) ISH using PLT1-specific DIG-labeled
probes and (e–h) PLT3-specific FITC-labeled probes (i). (a, e) An alkaline phosphatase-linked antibody was
used in combination with NBT/BCIP substrate for PLT1-specific DIG probe detection. (b, f) and (c, g) An
alkaline phosphatase-linked antibody was used in combination with Fast Red substrate for PLT1-specific DIG
probe detection. Nuclei are counterstained with DAPI (in c, d, g, h, j
0 , and k
0 ). (d, h, j–k
0 ) PLT1-specific DIG
probe detected with peroxidase-labeled antibody in combination with the TSA system TSA™ Plus CY3
(magenta). (i) Co-stained PLT1 (magenta) and PLT3 (cyan) mRNA after two rounds of TSA staining (PLT1
DIG-labeled mRNA stained with TSA™ Plus Cyanine 3-Kit and PLT3 FITC-labeled mRNA stained with TSA™
Plus FITC-Kit (PerkinElmer). Subcellular mRNA distribution of PLT1 (j–j
0 ) and PLT3 (k–k
0 ). Scale bars are
20 μm
14
Thomas Dresselhaus and Andrea Bleckmann
C until a red staining is
visible (initially check every 10 min; afterwards the periods can
be extended).
4. Stop the reaction by washing the samples four times with
PBS-T (see Note 22).
5. For light microscopy, the roots are transferred and separated in
a drop of 77% (v/v) glycerol/PBS on a glass slide using a
tweezer and cannulas.
6. For fluorescent microscopy the roots are transferred and separated in a drop of DAPI-containing anti-fading mounting
Fig. 3 Expression of the PLETHORA transcription factor genes in the root tip of Arabidopsis. Visualization of
PLT1 and PLT3 mRNA by (fluorescent) whole-mount RNA ISH. (a–d) ISH using PLT1-specific DIG-labeled
probes and (e–h) PLT3-specific FITC-labeled probes (i). (a, e) An alkaline phosphatase-linked antibody was
used in combination with NBT/BCIP substrate for PLT1-specific DIG probe detection. (b, f) and (c, g) An
alkaline phosphatase-linked antibody was used in combination with Fast Red substrate for PLT1-specific DIG
probe detection. Nuclei are counterstained with DAPI (in c, d, g, h, j
0 , and k
0 ). (d, h, j–k
0 ) PLT1-specific DIG
probe detected with peroxidase-labeled antibody in combination with the TSA system TSA™ Plus CY3
(magenta). (i) Co-stained PLT1 (magenta) and PLT3 (cyan) mRNA after two rounds of TSA staining (PLT1
DIG-labeled mRNA stained with TSA™ Plus Cyanine 3-Kit and PLT3 FITC-labeled mRNA stained with TSA™
Plus FITC-Kit (PerkinElmer). Subcellular mRNA distribution of PLT1 (j–j
0 ) and PLT3 (k–k
0 ). Scale bars are
20 μm
14
Thomas Dresselhaus and Andrea Bleckmann