

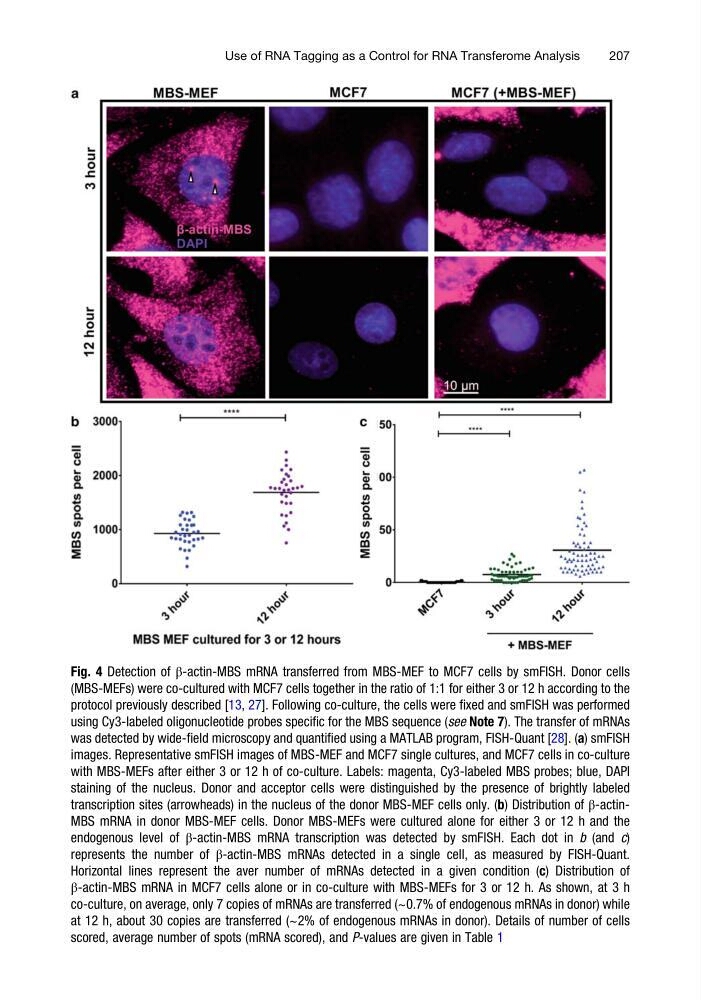
Fig. 4 Detection of β-actin-MBS mRNA transferred from MBS-MEF to MCF7 cells by smFISH. Donor cells
(MBS-MEFs) were co-cultured with MCF7 cells together in the ratio of 1:1 for either 3 or 12 h according to the
protocol previously described [13, 27]. Following co-culture, the cells were fixed and smFISH was performed
using Cy3-labeled oligonucleotide probes specific for the MBS sequence (see Note 7). The transfer of mRNAs
was detected by wide-field microscopy and quantified using a MATLAB program, FISH-Quant [28]. (a) smFISH
images. Representative smFISH images of MBS-MEF and MCF7 single cultures, and MCF7 cells in co-culture
with MBS-MEFs after either 3 or 12 h of co-culture. Labels: magenta, Cy3-labeled MBS probes; blue, DAPI
staining of the nucleus. Donor and acceptor cells were distinguished by the presence of brightly labeled
transcription sites (arrowheads) in the nucleus of the donor MBS-MEF cells only. (b) Distribution of β-actinMBS mRNA in donor MBS-MEF cells. Donor MBS-MEFs were cultured alone for either 3 or 12 h and the
endogenous level of β-actin-MBS mRNA transcription was detected by smFISH. Each dot in b (and c)
represents the number of β-actin-MBS mRNAs detected in a single cell, as measured by FISH-Quant.
Horizontal lines represent the aver number of mRNAs detected in a given condition (c) Distribution of
β-actin-MBS mRNA in MCF7 cells alone or in co-culture with MBS-MEFs for 3 or 12 h. As shown, at 3 h
co-culture, on average, only 7 copies of mRNAs are transferred (~0.7% of endogenous mRNAs in donor) while
at 12 h, about 30 copies are transferred (~2% of endogenous mRNAs in donor). Details of number of cells
scored, average number of spots (mRNA scored), and P-values are given in Table 1
Use of RNA Tagging as a Control for RNA Transferome Analysis
207
(MBS-MEFs) were co-cultured with MCF7 cells together in the ratio of 1:1 for either 3 or 12 h according to the
protocol previously described [13, 27]. Following co-culture, the cells were fixed and smFISH was performed
using Cy3-labeled oligonucleotide probes specific for the MBS sequence (see Note 7). The transfer of mRNAs
was detected by wide-field microscopy and quantified using a MATLAB program, FISH-Quant [28]. (a) smFISH
images. Representative smFISH images of MBS-MEF and MCF7 single cultures, and MCF7 cells in co-culture
with MBS-MEFs after either 3 or 12 h of co-culture. Labels: magenta, Cy3-labeled MBS probes; blue, DAPI
staining of the nucleus. Donor and acceptor cells were distinguished by the presence of brightly labeled
transcription sites (arrowheads) in the nucleus of the donor MBS-MEF cells only. (b) Distribution of β-actinMBS mRNA in donor MBS-MEF cells. Donor MBS-MEFs were cultured alone for either 3 or 12 h and the
endogenous level of β-actin-MBS mRNA transcription was detected by smFISH. Each dot in b (and c)
represents the number of β-actin-MBS mRNAs detected in a single cell, as measured by FISH-Quant.
Horizontal lines represent the aver number of mRNAs detected in a given condition (c) Distribution of
β-actin-MBS mRNA in MCF7 cells alone or in co-culture with MBS-MEFs for 3 or 12 h. As shown, at 3 h
co-culture, on average, only 7 copies of mRNAs are transferred (~0.7% of endogenous mRNAs in donor) while
at 12 h, about 30 copies are transferred (~2% of endogenous mRNAs in donor). Details of number of cells
scored, average number of spots (mRNA scored), and P-values are given in Table 1
Use of RNA Tagging as a Control for RNA Transferome Analysis
207