

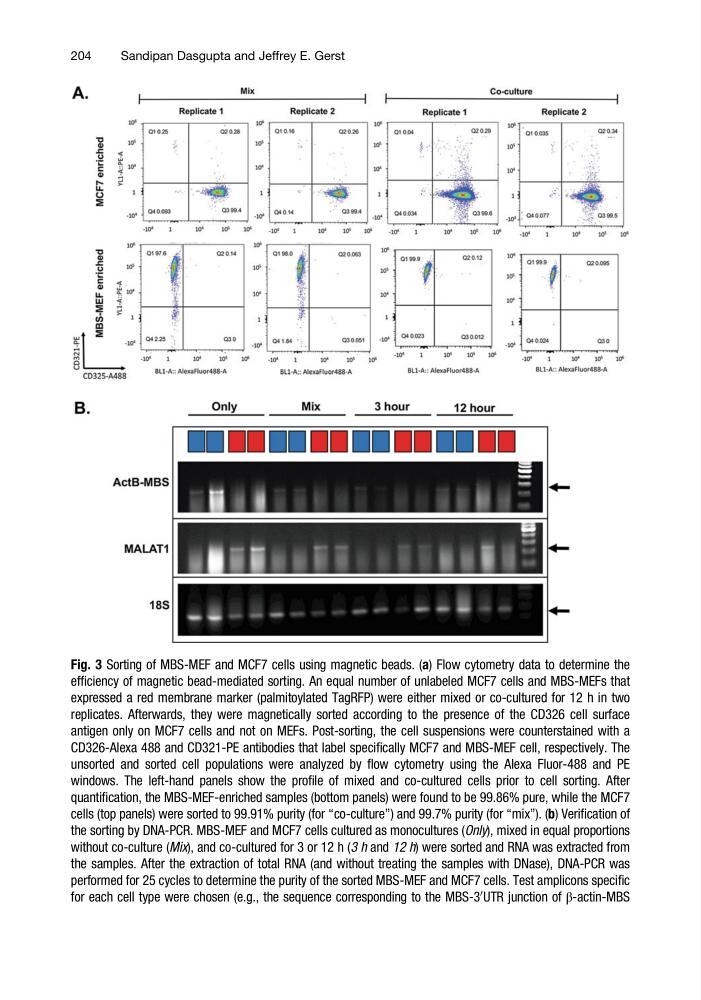
Fig. 3 Sorting of MBS-MEF and MCF7 cells using magnetic beads. (a) Flow cytometry data to determine the
efficiency of magnetic bead-mediated sorting. An equal number of unlabeled MCF7 cells and MBS-MEFs that
expressed a red membrane marker (palmitoylated TagRFP) were either mixed or co-cultured for 12 h in two
replicates. Afterwards, they were magnetically sorted according to the presence of the CD326 cell surface
antigen only on MCF7 cells and not on MEFs. Post-sorting, the cell suspensions were counterstained with a
CD326-Alexa 488 and CD321-PE antibodies that label specifically MCF7 and MBS-MEF cell, respectively. The
unsorted and sorted cell populations were analyzed by flow cytometry using the Alexa Fluor-488 and PE
windows. The left-hand panels show the profile of mixed and co-cultured cells prior to cell sorting. After
quantification, the MBS-MEF-enriched samples (bottom panels) were found to be 99.86% pure, while the MCF7
cells (top panels) were sorted to 99.91% purity (for “co-culture”) and 99.7% purity (for “mix”). (b) Verification of
the sorting by DNA-PCR. MBS-MEF and MCF7 cells cultured as monocultures (Only), mixed in equal proportions
without co-culture (Mix), and co-cultured for 3 or 12 h (3 h and 12 h) were sorted and RNA was extracted from
the samples. After the extraction of total RNA (and without treating the samples with DNase), DNA-PCR was
performed for 25 cycles to determine the purity of the sorted MBS-MEF and MCF7 cells. Test amplicons specific
for each cell type were chosen (e.g., the sequence corresponding to the MBS-3
0 UTR junction of β-actin-MBS
204
Sandipan Dasgupta and Jeffrey E. Gerst
efficiency of magnetic bead-mediated sorting. An equal number of unlabeled MCF7 cells and MBS-MEFs that
expressed a red membrane marker (palmitoylated TagRFP) were either mixed or co-cultured for 12 h in two
replicates. Afterwards, they were magnetically sorted according to the presence of the CD326 cell surface
antigen only on MCF7 cells and not on MEFs. Post-sorting, the cell suspensions were counterstained with a
CD326-Alexa 488 and CD321-PE antibodies that label specifically MCF7 and MBS-MEF cell, respectively. The
unsorted and sorted cell populations were analyzed by flow cytometry using the Alexa Fluor-488 and PE
windows. The left-hand panels show the profile of mixed and co-cultured cells prior to cell sorting. After
quantification, the MBS-MEF-enriched samples (bottom panels) were found to be 99.86% pure, while the MCF7
cells (top panels) were sorted to 99.91% purity (for “co-culture”) and 99.7% purity (for “mix”). (b) Verification of
the sorting by DNA-PCR. MBS-MEF and MCF7 cells cultured as monocultures (Only), mixed in equal proportions
without co-culture (Mix), and co-cultured for 3 or 12 h (3 h and 12 h) were sorted and RNA was extracted from
the samples. After the extraction of total RNA (and without treating the samples with DNase), DNA-PCR was
performed for 25 cycles to determine the purity of the sorted MBS-MEF and MCF7 cells. Test amplicons specific
for each cell type were chosen (e.g., the sequence corresponding to the MBS-3
0 UTR junction of β-actin-MBS
204
Sandipan Dasgupta and Jeffrey E. Gerst