

SFs—the RMS value turned out to be 11.77 cm
−1 . The presented in this paragraph
FF scaling procedure is regarded now as a standard one in obtaining accurate
vibrational spectra in spite of the fact that it was published 20 years ago.
Another contribution to the development of the SQM procedure came in 2002
[67]. The authors considered a series of 20 molecules (341 frequencies) containing
second- and third-row atoms (called first- and second-row atoms, respectively, in
the paper). The molecules included the already investigated structural motifs based
on C, H, N, and O second-row atoms. In addition, they contained fluorine as well as
sulfur and phosphorus (in various oxidation states), silicon, and chlorine atoms. In
this way, a number of additional (to the already investigated) structural motifs were
introduced. Surprisingly, the authors decided to use SQM scheme based on the
non-redundant set of NICs rather than more flexible scheme based on redundant set
of PICs. The disadvantages of the adopted approach are discussed in the paper,
though. The B3LYP/6-31G* computational level was adopted. In the case of the
types of NICs for which the SFs are known, they decided to use the precomputed
values [63]. The new SFs were attributed to new structural motifs; the overall set
consisted of 20 SFs. New SFs were optimized, and the overall RMS was found to
be merely 10.7 cm
−1 for this very diversified set of molecules. It is worth to
mention that optimization of all SFs only slightly improved the least-squares fit
(RMS = 10.6 cm
−1 ). It turned out that most of the SFs initially taken from [63] did
not change significantly: the typical relative deviation was well below 1% (it was
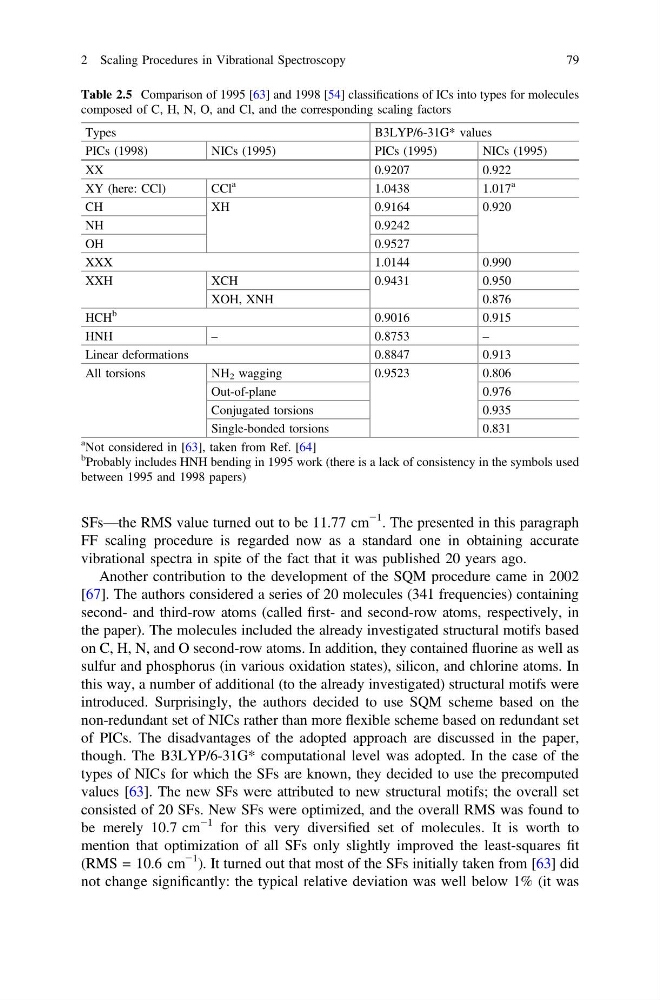
Table 2.5 Comparison of 1995 [63] and 1998 [54] classifications of ICs into types for molecules
composed of C, H, N, O, and Cl, and the corresponding scaling factors
Types
B3LYP/6-31G* values
PICs (1998)
NICs (1995)
PICs (1995)
NICs (1995)
XX
0.9207
0.922
XY (here: CCl)
CCl
a
1.0438
1.017
a
CH
XH
0.9164
0.920
NH
0.9242
OH
0.9527
XXX
1.0144
0.990
XXH
XCH
0.9431
0.950
XOH, XNH
0.876
HCH
b
0.9016
0.915
HNH
–
0.8753
–
Linear deformations
0.8847
0.913
All torsions
NH 2 wagging
0.9523
0.806
Out-of-plane
0.976
Conjugated torsions
0.935
Single-bonded torsions
0.831
a Not considered in [63], taken from Ref. [64]
b
Probably includes HNH bending in 1995 work (there is a lack of consistency in the symbols used
between 1995 and 1998 papers)
2 Scaling Procedures in Vibrational Spectroscopy
79
−1 . The presented in this paragraph
FF scaling procedure is regarded now as a standard one in obtaining accurate
vibrational spectra in spite of the fact that it was published 20 years ago.
Another contribution to the development of the SQM procedure came in 2002
[67]. The authors considered a series of 20 molecules (341 frequencies) containing
second- and third-row atoms (called first- and second-row atoms, respectively, in
the paper). The molecules included the already investigated structural motifs based
on C, H, N, and O second-row atoms. In addition, they contained fluorine as well as
sulfur and phosphorus (in various oxidation states), silicon, and chlorine atoms. In
this way, a number of additional (to the already investigated) structural motifs were
introduced. Surprisingly, the authors decided to use SQM scheme based on the
non-redundant set of NICs rather than more flexible scheme based on redundant set
of PICs. The disadvantages of the adopted approach are discussed in the paper,
though. The B3LYP/6-31G* computational level was adopted. In the case of the
types of NICs for which the SFs are known, they decided to use the precomputed
values [63]. The new SFs were attributed to new structural motifs; the overall set
consisted of 20 SFs. New SFs were optimized, and the overall RMS was found to
be merely 10.7 cm
−1 for this very diversified set of molecules. It is worth to
mention that optimization of all SFs only slightly improved the least-squares fit
(RMS = 10.6 cm
−1 ). It turned out that most of the SFs initially taken from [63] did
not change significantly: the typical relative deviation was well below 1% (it was
Table 2.5 Comparison of 1995 [63] and 1998 [54] classifications of ICs into types for molecules
composed of C, H, N, O, and Cl, and the corresponding scaling factors
Types
B3LYP/6-31G* values
PICs (1998)
NICs (1995)
PICs (1995)
NICs (1995)
XX
0.9207
0.922
XY (here: CCl)
CCl
a
1.0438
1.017
a
CH
XH
0.9164
0.920
NH
0.9242
OH
0.9527
XXX
1.0144
0.990
XXH
XCH
0.9431
0.950
XOH, XNH
0.876
HCH
b
0.9016
0.915
HNH
–
0.8753
–
Linear deformations
0.8847
0.913
All torsions
NH 2 wagging
0.9523
0.806
Out-of-plane
0.976
Conjugated torsions
0.935
Single-bonded torsions
0.831
a Not considered in [63], taken from Ref. [64]
b
Probably includes HNH bending in 1995 work (there is a lack of consistency in the symbols used
between 1995 and 1998 papers)
2 Scaling Procedures in Vibrational Spectroscopy
79