

the binder, pigment particle size, paint layer thickness and structure, state of
degradation) which in turn make conclusions based on a spectral resemblance
between artwork and database samples often difficult and sometimes misleading.
Other spectroscopic techniques (e.g., Raman, FTIR, XRF, LIBS, to name the most
often used ones) might provide additional information allowing for proper identification of the artists’ palette [140]. Efforts to build such spectral libraries were
undertaken by many researchers and organizations—see [141] for organic dyes in
colored papers [142]—for modern gouache paints [143–145]—for pigments and
pigment mixtures. Especially, Italian researchers have done a great deal of work in
this respect—compare the Web page [146] devoted to the topic which combines
reference spectra collected from 24 papers published by Bacci and co-workers
between 1992 and 2007.
The mode of operation often used in analysis of artworks for Vis reflectance (but
also UV, NIR, and some other spectroscopic techniques) is the fiber optic reflectance spectroscopy (FORS), first introduced to the analysis of heritage objects in
1987 by M. Bacci and co-workers. FORS allows performing point measurements
for objects regardless of their size and location, as the equipment could be made
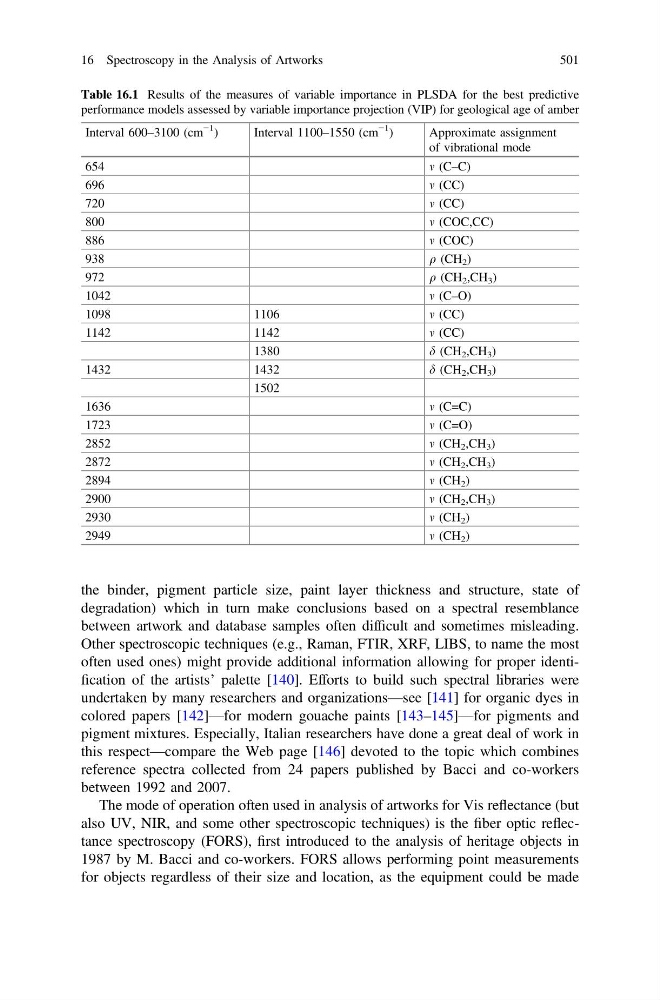
Table 16.1 Results of the measures of variable importance in PLSDA for the best predictive
performance models assessed by variable importance projection (VIP) for geological age of amber
Interval 600–3100 (cm
−1
)
Interval 1100–1550 (cm
−1
)
Approximate assignment
of vibrational mode
654
m (C–C)
696
m (CC)
720
m (CC)
800
m (COC,CC)
886
m (COC)
938
q (CH 2 )
972
q (CH 2 ,CH 3 )
1042
m (C–O)
1098
1106
m (CC)
1142
1142
m (CC)
1380
d (CH 2 ,CH 3 )
1432
1432
d (CH 2 ,CH 3 )
1502
1636
m (C=C)
1723
m (C=O)
2852
m (CH 2 ,CH 3 )
2872
m (CH 2 ,CH 3 )
2894
m (CH 2 )
2900
m (CH 2 ,CH 3 )
2930
m (CH 2 )
2949
m (CH 2 )
16 Spectroscopy in the Analysis of Artworks
501
degradation) which in turn make conclusions based on a spectral resemblance
between artwork and database samples often difficult and sometimes misleading.
Other spectroscopic techniques (e.g., Raman, FTIR, XRF, LIBS, to name the most
often used ones) might provide additional information allowing for proper identification of the artists’ palette [140]. Efforts to build such spectral libraries were
undertaken by many researchers and organizations—see [141] for organic dyes in
colored papers [142]—for modern gouache paints [143–145]—for pigments and
pigment mixtures. Especially, Italian researchers have done a great deal of work in
this respect—compare the Web page [146] devoted to the topic which combines
reference spectra collected from 24 papers published by Bacci and co-workers
between 1992 and 2007.
The mode of operation often used in analysis of artworks for Vis reflectance (but
also UV, NIR, and some other spectroscopic techniques) is the fiber optic reflectance spectroscopy (FORS), first introduced to the analysis of heritage objects in
1987 by M. Bacci and co-workers. FORS allows performing point measurements
for objects regardless of their size and location, as the equipment could be made
Table 16.1 Results of the measures of variable importance in PLSDA for the best predictive
performance models assessed by variable importance projection (VIP) for geological age of amber
Interval 600–3100 (cm
−1
)
Interval 1100–1550 (cm
−1
)
Approximate assignment
of vibrational mode
654
m (C–C)
696
m (CC)
720
m (CC)
800
m (COC,CC)
886
m (COC)
938
q (CH 2 )
972
q (CH 2 ,CH 3 )
1042
m (C–O)
1098
1106
m (CC)
1142
1142
m (CC)
1380
d (CH 2 ,CH 3 )
1432
1432
d (CH 2 ,CH 3 )
1502
1636
m (C=C)
1723
m (C=O)
2852
m (CH 2 ,CH 3 )
2872
m (CH 2 ,CH 3 )
2894
m (CH 2 )
2900
m (CH 2 ,CH 3 )
2930
m (CH 2 )
2949
m (CH 2 )
16 Spectroscopy in the Analysis of Artworks
501