

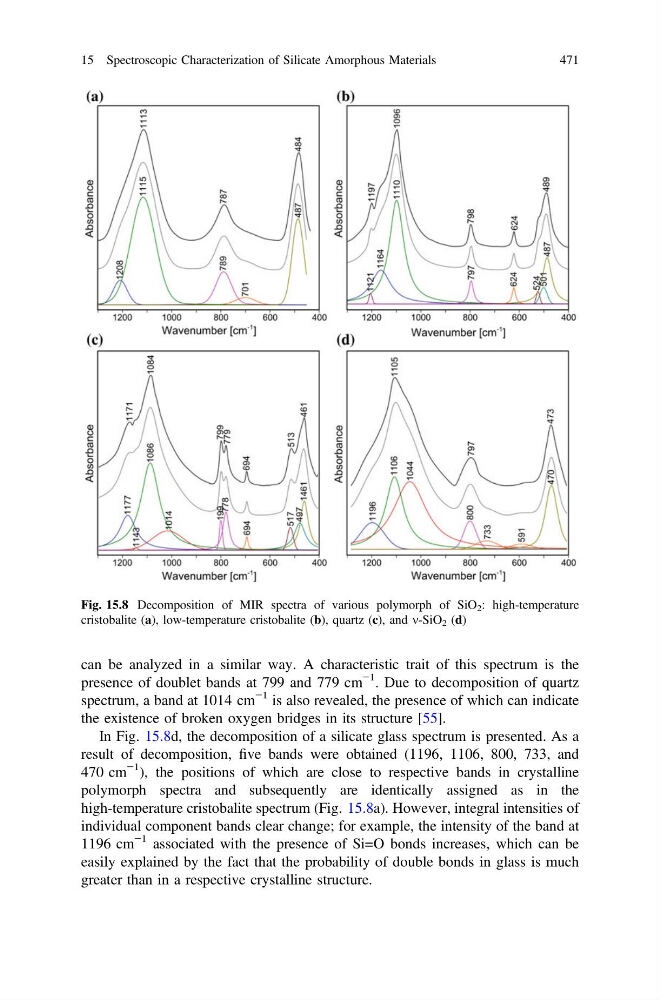
can be analyzed in a similar way. A characteristic trait of this spectrum is the
presence of doublet bands at 799 and 779 cm
−1 . Due to decomposition of quartz
spectrum, a band at 1014 cm
−1 is also revealed, the presence of which can indicate
the existence of broken oxygen bridges in its structure [55].
In Fig. 15.8d, the decomposition of a silicate glass spectrum is presented. As a
result of decomposition, five bands were obtained (1196, 1106, 800, 733, and
470 cm
−1 ), the positions of which are close to respective bands in crystalline
polymorph spectra and subsequently are identically assigned as in the
high-temperature cristobalite spectrum (Fig. 15.8a). However, integral intensities of
individual component bands clear change; for example, the intensity of the band at
1196 cm
−1 associated with the presence of Si=O bonds increases, which can be
easily explained by the fact that the probability of double bonds in glass is much
greater than in a respective crystalline structure.
Fig. 15.8 Decomposition of MIR spectra of various polymorph of SiO 2 : high-temperature
cristobalite (a), low-temperature cristobalite (b), quartz (c), and m-SiO 2 (d)
15 Spectroscopic Characterization of Silicate Amorphous Materials
471
presence of doublet bands at 799 and 779 cm
−1 . Due to decomposition of quartz
spectrum, a band at 1014 cm
−1 is also revealed, the presence of which can indicate
the existence of broken oxygen bridges in its structure [55].
In Fig. 15.8d, the decomposition of a silicate glass spectrum is presented. As a
result of decomposition, five bands were obtained (1196, 1106, 800, 733, and
470 cm
−1 ), the positions of which are close to respective bands in crystalline
polymorph spectra and subsequently are identically assigned as in the
high-temperature cristobalite spectrum (Fig. 15.8a). However, integral intensities of
individual component bands clear change; for example, the intensity of the band at
1196 cm
−1 associated with the presence of Si=O bonds increases, which can be
easily explained by the fact that the probability of double bonds in glass is much
greater than in a respective crystalline structure.
Fig. 15.8 Decomposition of MIR spectra of various polymorph of SiO 2 : high-temperature
cristobalite (a), low-temperature cristobalite (b), quartz (c), and m-SiO 2 (d)
15 Spectroscopic Characterization of Silicate Amorphous Materials
471