

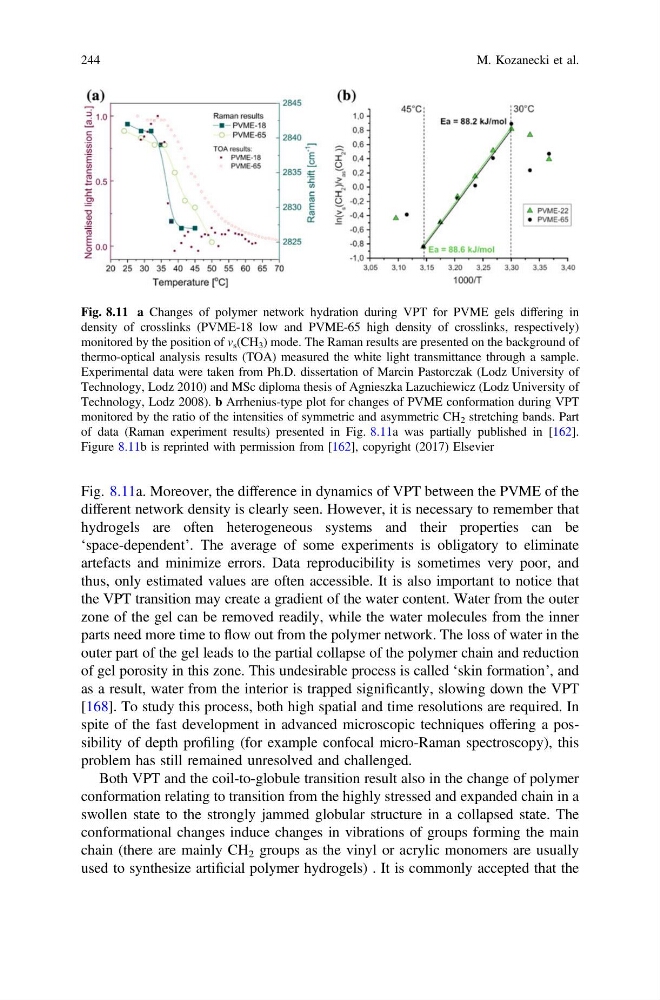
Fig. 8.11a. Moreover, the difference in dynamics of VPT between the PVME of the
different network density is clearly seen. However, it is necessary to remember that
hydrogels are often heterogeneous systems and their properties can be
‘space-dependent’. The average of some experiments is obligatory to eliminate
artefacts and minimize errors. Data reproducibility is sometimes very poor, and
thus, only estimated values are often accessible. It is also important to notice that
the VPT transition may create a gradient of the water content. Water from the outer
zone of the gel can be removed readily, while the water molecules from the inner
parts need more time to flow out from the polymer network. The loss of water in the
outer part of the gel leads to the partial collapse of the polymer chain and reduction
of gel porosity in this zone. This undesirable process is called ‘skin formation’, and
as a result, water from the interior is trapped significantly, slowing down the VPT
[168]. To study this process, both high spatial and time resolutions are required. In
spite of the fast development in advanced microscopic techniques offering a possibility of depth profiling (for example confocal micro-Raman spectroscopy), this
problem has still remained unresolved and challenged.
Both VPT and the coil-to-globule transition result also in the change of polymer
conformation relating to transition from the highly stressed and expanded chain in a
swollen state to the strongly jammed globular structure in a collapsed state. The
conformational changes induce changes in vibrations of groups forming the main
chain (there are mainly CH 2 groups as the vinyl or acrylic monomers are usually
used to synthesize artificial polymer hydrogels) . It is commonly accepted that the
Fig. 8.11 a Changes of polymer network hydration during VPT for PVME gels differing in
density of crosslinks (PVME-18 low and PVME-65 high density of crosslinks, respectively)
monitored by the position of v s (CH 3 ) mode. The Raman results are presented on the background of
thermo-optical analysis results (TOA) measured the white light transmittance through a sample.
Experimental data were taken from Ph.D. dissertation of Marcin Pastorczak (Lodz University of
Technology, Lodz 2010) and MSc diploma thesis of Agnieszka Lazuchiewicz (Lodz University of
Technology, Lodz 2008). b Arrhenius-type plot for changes of PVME conformation during VPT
monitored by the ratio of the intensities of symmetric and asymmetric CH 2 stretching bands. Part
of data (Raman experiment results) presented in Fig. 8.11a was partially published in [162].
Figure 8.11b is reprinted with permission from [162], copyright (2017) Elsevier
244
M. Kozanecki et al.
different network density is clearly seen. However, it is necessary to remember that
hydrogels are often heterogeneous systems and their properties can be
‘space-dependent’. The average of some experiments is obligatory to eliminate
artefacts and minimize errors. Data reproducibility is sometimes very poor, and
thus, only estimated values are often accessible. It is also important to notice that
the VPT transition may create a gradient of the water content. Water from the outer
zone of the gel can be removed readily, while the water molecules from the inner
parts need more time to flow out from the polymer network. The loss of water in the
outer part of the gel leads to the partial collapse of the polymer chain and reduction
of gel porosity in this zone. This undesirable process is called ‘skin formation’, and
as a result, water from the interior is trapped significantly, slowing down the VPT
[168]. To study this process, both high spatial and time resolutions are required. In
spite of the fast development in advanced microscopic techniques offering a possibility of depth profiling (for example confocal micro-Raman spectroscopy), this
problem has still remained unresolved and challenged.
Both VPT and the coil-to-globule transition result also in the change of polymer
conformation relating to transition from the highly stressed and expanded chain in a
swollen state to the strongly jammed globular structure in a collapsed state. The
conformational changes induce changes in vibrations of groups forming the main
chain (there are mainly CH 2 groups as the vinyl or acrylic monomers are usually
used to synthesize artificial polymer hydrogels) . It is commonly accepted that the
Fig. 8.11 a Changes of polymer network hydration during VPT for PVME gels differing in
density of crosslinks (PVME-18 low and PVME-65 high density of crosslinks, respectively)
monitored by the position of v s (CH 3 ) mode. The Raman results are presented on the background of
thermo-optical analysis results (TOA) measured the white light transmittance through a sample.
Experimental data were taken from Ph.D. dissertation of Marcin Pastorczak (Lodz University of
Technology, Lodz 2010) and MSc diploma thesis of Agnieszka Lazuchiewicz (Lodz University of
Technology, Lodz 2008). b Arrhenius-type plot for changes of PVME conformation during VPT
monitored by the ratio of the intensities of symmetric and asymmetric CH 2 stretching bands. Part
of data (Raman experiment results) presented in Fig. 8.11a was partially published in [162].
Figure 8.11b is reprinted with permission from [162], copyright (2017) Elsevier
244
M. Kozanecki et al.