

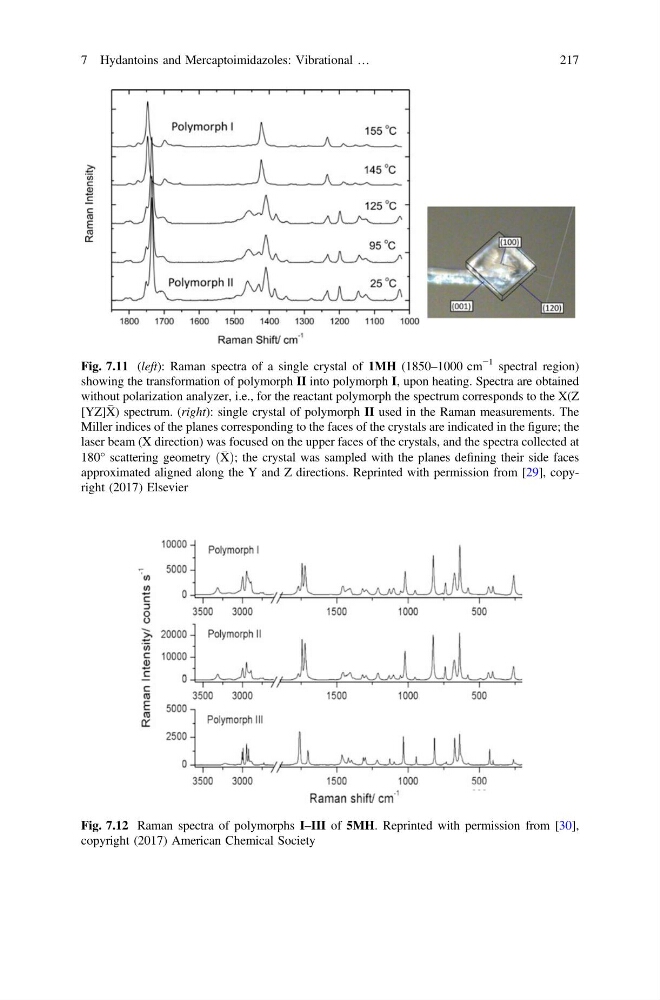
Fig. 7.11 (left): Raman spectra of a single crystal of 1MH (1850–1000 cm
−1 spectral region)
showing the transformation of polymorph II into polymorph I, upon heating. Spectra are obtained
without polarization analyzer, i.e., for the reactant polymorph the spectrum corresponds to the X(Z
[YZ]
X) spectrum. (right): single crystal of polymorph II used in the Raman measurements. The
Miller indices of the planes corresponding to the faces of the crystals are indicated in the figure; the
laser beam (X direction) was focused on the upper faces of the crystals, and the spectra collected at
180° scattering geometry ð
XÞ; the crystal was sampled with the planes defining their side faces
approximated aligned along the Y and Z directions. Reprinted with permission from [29], copyright (2017) Elsevier
Fig. 7.12 Raman spectra of polymorphs I–III of 5MH. Reprinted with permission from [30],
copyright (2017) American Chemical Society
7 Hydantoins and Mercaptoimidazoles: Vibrational …
217
−1 spectral region)
showing the transformation of polymorph II into polymorph I, upon heating. Spectra are obtained
without polarization analyzer, i.e., for the reactant polymorph the spectrum corresponds to the X(Z
[YZ]
X) spectrum. (right): single crystal of polymorph II used in the Raman measurements. The
Miller indices of the planes corresponding to the faces of the crystals are indicated in the figure; the
laser beam (X direction) was focused on the upper faces of the crystals, and the spectra collected at
180° scattering geometry ð
XÞ; the crystal was sampled with the planes defining their side faces
approximated aligned along the Y and Z directions. Reprinted with permission from [29], copyright (2017) Elsevier
Fig. 7.12 Raman spectra of polymorphs I–III of 5MH. Reprinted with permission from [30],
copyright (2017) American Chemical Society
7 Hydantoins and Mercaptoimidazoles: Vibrational …
217