

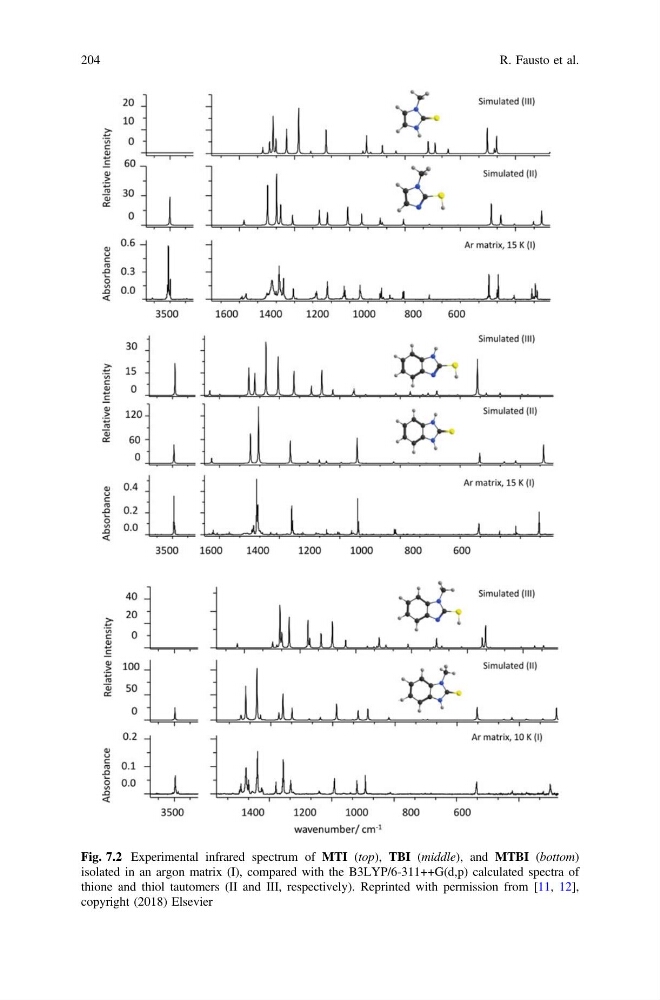
Fig. 7.2 Experimental infrared spectrum of MTI (top), TBI (middle), and MTBI (bottom)
isolated in an argon matrix (I), compared with the B3LYP/6-311++G(d,p) calculated spectra of
thione and thiol tautomers (II and III, respectively). Reprinted with permission from [11, 12],
copyright (2018) Elsevier
204
R. Fausto et al.
isolated in an argon matrix (I), compared with the B3LYP/6-311++G(d,p) calculated spectra of
thione and thiol tautomers (II and III, respectively). Reprinted with permission from [11, 12],
copyright (2018) Elsevier
204
R. Fausto et al.