

affected by atherosclerosis [168]. Furthermore, Raman spectroscopy was applied in
classification of various types of brain tumors [169] as well as in detection of
tumors in breast [170, 171], skin [172], lung [173], liver [174], cervical [175, 176]
and prostate [177] tissues. These works showed the applicability of Raman spectroscopy to characterize chemically malignant tissues and to define cancer margins.
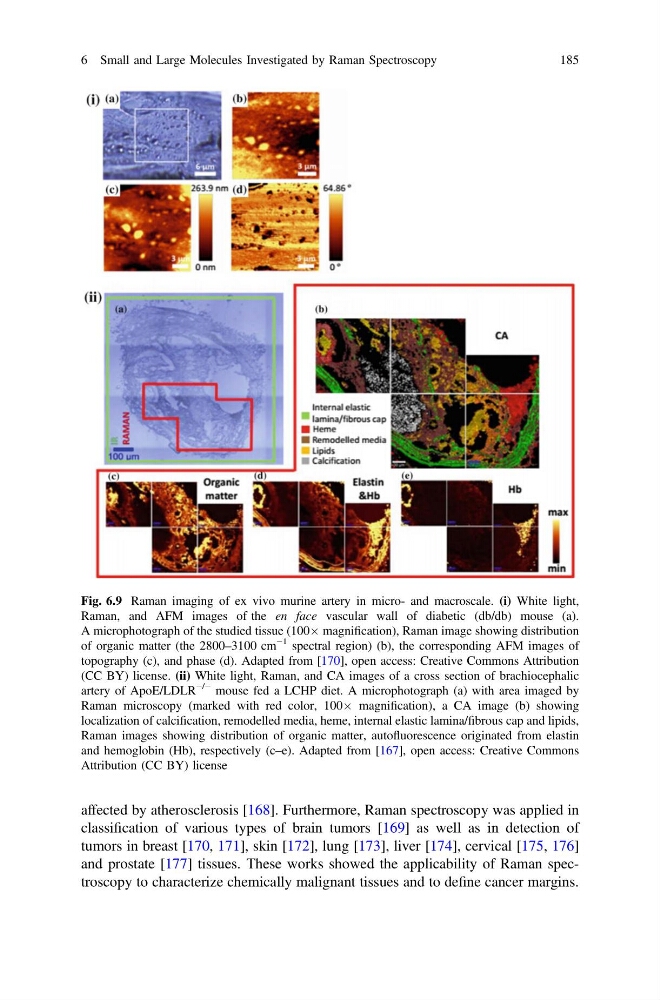
Fig. 6.9 Raman imaging of ex vivo murine artery in micro- and macroscale. (i) White light,
Raman, and AFM images of the en face vascular wall of diabetic (db/db) mouse (a).
A microphotograph of the studied tissue (100Â magnification), Raman image showing distribution
of organic matter (the 2800–3100 cm
−1 spectral region) (b), the corresponding AFM images of
topography (c), and phase (d). Adapted from [170], open access: Creative Commons Attribution
(CC BY) license. (ii) White light, Raman, and CA images of a cross section of brachiocephalic
artery of ApoE/LDLR
−/− mouse fed a LCHP diet. A microphotograph (a) with area imaged by
Raman microscopy (marked with red color, 100Â magnification), a CA image (b) showing
localization of calcification, remodelled media, heme, internal elastic lamina/fibrous cap and lipids,
Raman images showing distribution of organic matter, autofluorescence originated from elastin
and hemoglobin (Hb), respectively (c–e). Adapted from [167], open access: Creative Commons
Attribution (CC BY) license
6 Small and Large Molecules Investigated by Raman Spectroscopy
185
classification of various types of brain tumors [169] as well as in detection of
tumors in breast [170, 171], skin [172], lung [173], liver [174], cervical [175, 176]
and prostate [177] tissues. These works showed the applicability of Raman spectroscopy to characterize chemically malignant tissues and to define cancer margins.
Fig. 6.9 Raman imaging of ex vivo murine artery in micro- and macroscale. (i) White light,
Raman, and AFM images of the en face vascular wall of diabetic (db/db) mouse (a).
A microphotograph of the studied tissue (100Â magnification), Raman image showing distribution
of organic matter (the 2800–3100 cm
−1 spectral region) (b), the corresponding AFM images of
topography (c), and phase (d). Adapted from [170], open access: Creative Commons Attribution
(CC BY) license. (ii) White light, Raman, and CA images of a cross section of brachiocephalic
artery of ApoE/LDLR
−/− mouse fed a LCHP diet. A microphotograph (a) with area imaged by
Raman microscopy (marked with red color, 100Â magnification), a CA image (b) showing
localization of calcification, remodelled media, heme, internal elastic lamina/fibrous cap and lipids,
Raman images showing distribution of organic matter, autofluorescence originated from elastin
and hemoglobin (Hb), respectively (c–e). Adapted from [167], open access: Creative Commons
Attribution (CC BY) license
6 Small and Large Molecules Investigated by Raman Spectroscopy
185