

104
6 Applications
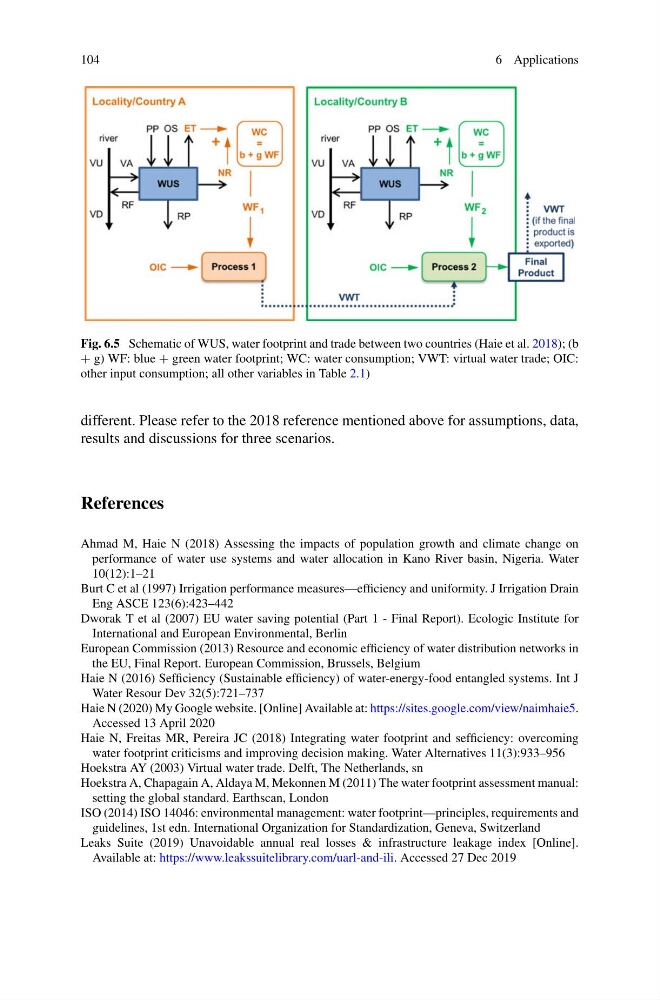
Fig. 6.5 Schematic of WUS, water footprint and trade between two countries (Haie et al. 2018); (b
+ g) WF: blue + green water footprint; WC: water consumption; VWT: virtual water trade; OIC:
other input consumption; all other variables in Table 2.1)
different. Please refer to the 2018 reference mentioned above for assumptions, data,
results and discussions for three scenarios.
References
Ahmad M, Haie N (2018) Assessing the impacts of population growth and climate change on
performance of water use systems and water allocation in Kano River basin, Nigeria. Water
10(12):1–21
Burt C et al (1997) Irrigation performance measures—efficiency and uniformity. J Irrigation Drain
Eng ASCE 123(6):423–442
Dworak T et al (2007) EU water saving potential (Part 1 - Final Report). Ecologic Institute for
International and European Environmental, Berlin
European Commission (2013) Resource and economic efficiency of water distribution networks in
the EU, Final Report. European Commission, Brussels, Belgium
Haie N (2016) Sefficiency (Sustainable efficiency) of water-energy-food entangled systems. Int J
Water Resour Dev 32(5):721–737
Haie N (2020) My Google website. [Online] Available at: https://sites.google.com/view/naimhaie5.
Accessed 13 April 2020
Haie N, Freitas MR, Pereira JC (2018) Integrating water footprint and sefficiency: overcoming
water footprint criticisms and improving decision making. Water Alternatives 11(3):933–956
Hoekstra AY (2003) Virtual water trade. Delft, The Netherlands, sn
Hoekstra A, Chapagain A, Aldaya M, Mekonnen M (2011) The water footprint assessment manual:
setting the global standard. Earthscan, London
ISO (2014) ISO 14046: environmental management: water footprint—principles, requirements and
guidelines, 1st edn. International Organization for Standardization, Geneva, Switzerland
Leaks Suite (2019) Unavoidable annual real losses & infrastructure leakage index [Online].
Available at: https://www.leakssuitelibrary.com/uarl-and-ili. Accessed 27 Dec 2019
6 Applications
Fig. 6.5 Schematic of WUS, water footprint and trade between two countries (Haie et al. 2018); (b
+ g) WF: blue + green water footprint; WC: water consumption; VWT: virtual water trade; OIC:
other input consumption; all other variables in Table 2.1)
different. Please refer to the 2018 reference mentioned above for assumptions, data,
results and discussions for three scenarios.
References
Ahmad M, Haie N (2018) Assessing the impacts of population growth and climate change on
performance of water use systems and water allocation in Kano River basin, Nigeria. Water
10(12):1–21
Burt C et al (1997) Irrigation performance measures—efficiency and uniformity. J Irrigation Drain
Eng ASCE 123(6):423–442
Dworak T et al (2007) EU water saving potential (Part 1 - Final Report). Ecologic Institute for
International and European Environmental, Berlin
European Commission (2013) Resource and economic efficiency of water distribution networks in
the EU, Final Report. European Commission, Brussels, Belgium
Haie N (2016) Sefficiency (Sustainable efficiency) of water-energy-food entangled systems. Int J
Water Resour Dev 32(5):721–737
Haie N (2020) My Google website. [Online] Available at: https://sites.google.com/view/naimhaie5.
Accessed 13 April 2020
Haie N, Freitas MR, Pereira JC (2018) Integrating water footprint and sefficiency: overcoming
water footprint criticisms and improving decision making. Water Alternatives 11(3):933–956
Hoekstra AY (2003) Virtual water trade. Delft, The Netherlands, sn
Hoekstra A, Chapagain A, Aldaya M, Mekonnen M (2011) The water footprint assessment manual:
setting the global standard. Earthscan, London
ISO (2014) ISO 14046: environmental management: water footprint—principles, requirements and
guidelines, 1st edn. International Organization for Standardization, Geneva, Switzerland
Leaks Suite (2019) Unavoidable annual real losses & infrastructure leakage index [Online].
Available at: https://www.leakssuitelibrary.com/uarl-and-ili. Accessed 27 Dec 2019