

98
6 Applications
6.4 Farm
In most parts of the world, crop growth consumes most of the available freshwater
in a region, hence making its efficient use a top priority. Assuming a one to one
relationship between WPTs and WPIs, Fig. 2.1 (without NR) becomes the schematic
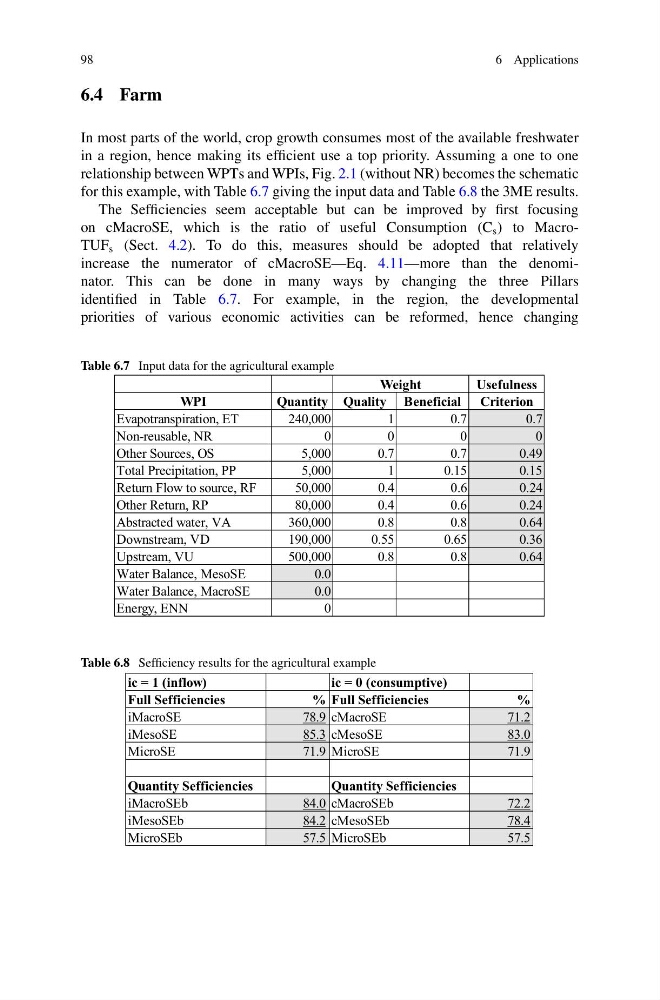
for this example, with Table 6.7 giving the input data and Table 6.8 the 3ME results.
The Sefficiencies seem acceptable but can be improved by first focusing
on cMacroSE, which is the ratio of useful Consumption (C s ) to MacroTUF s (Sect. 4.2). To do this, measures should be adopted that relatively
increase the numerator of cMacroSE—Eq. 4.11—more than the denominator. This can be done in many ways by changing the three Pillars
identified in Table 6.7. For example, in the region, the developmental
priorities of various economic activities can be reformed, hence changing
Table 6.7 Input data for the agricultural example
Usefulness
WPI
Quantity Quality Beneficial Criterion
Evapotranspiration, ET
240,000
1
0.7
0.7
Non-reusable, NR
0
0
0
0
Other Sources, OS
5,000
0.7
0.7
0.49
Total Precipitation, PP
5,000
1
0.15
0.15
Return Flow to source, RF
50,000
0.4
0.6
0.24
Other Return, RP
80,000
0.4
0.6
0.24
Abstracted water, VA
360,000
0.8
0.8
0.64
Downstream, VD
190,000
0.55
0.65
0.36
Upstream, VU
500,000
0.8
0.8
0.64
Water Balance, MesoSE
0.0
Water Balance, MacroSE
0.0
Energy, ENN
0
Weight
Table 6.8 Sefficiency results for the agricultural example
ic = 1 (inflow)
ic = 0 (consumptive)
Full Sefficiencies
% Full Sefficiencies
%
iMacroSE
78.9 cMacroSE
71.2
iMesoSE
85.3 cMesoSE
83.0
MicroSE
71.9 MicroSE
71.9
Quantity Sefficiencies
Quantity Sefficiencies
iMacroSEb
84.0 cMacroSEb
72.2
iMesoSEb
84.2 cMesoSEb
78.4
MicroSEb
57.5 MicroSEb
57.5
6 Applications
6.4 Farm
In most parts of the world, crop growth consumes most of the available freshwater
in a region, hence making its efficient use a top priority. Assuming a one to one
relationship between WPTs and WPIs, Fig. 2.1 (without NR) becomes the schematic
for this example, with Table 6.7 giving the input data and Table 6.8 the 3ME results.
The Sefficiencies seem acceptable but can be improved by first focusing
on cMacroSE, which is the ratio of useful Consumption (C s ) to MacroTUF s (Sect. 4.2). To do this, measures should be adopted that relatively
increase the numerator of cMacroSE—Eq. 4.11—more than the denominator. This can be done in many ways by changing the three Pillars
identified in Table 6.7. For example, in the region, the developmental
priorities of various economic activities can be reformed, hence changing
Table 6.7 Input data for the agricultural example
Usefulness
WPI
Quantity Quality Beneficial Criterion
Evapotranspiration, ET
240,000
1
0.7
0.7
Non-reusable, NR
0
0
0
0
Other Sources, OS
5,000
0.7
0.7
0.49
Total Precipitation, PP
5,000
1
0.15
0.15
Return Flow to source, RF
50,000
0.4
0.6
0.24
Other Return, RP
80,000
0.4
0.6
0.24
Abstracted water, VA
360,000
0.8
0.8
0.64
Downstream, VD
190,000
0.55
0.65
0.36
Upstream, VU
500,000
0.8
0.8
0.64
Water Balance, MesoSE
0.0
Water Balance, MacroSE
0.0
Energy, ENN
0
Weight
Table 6.8 Sefficiency results for the agricultural example
ic = 1 (inflow)
ic = 0 (consumptive)
Full Sefficiencies
% Full Sefficiencies
%
iMacroSE
78.9 cMacroSE
71.2
iMesoSE
85.3 cMesoSE
83.0
MicroSE
71.9 MicroSE
71.9
Quantity Sefficiencies
Quantity Sefficiencies
iMacroSEb
84.0 cMacroSEb
72.2
iMesoSEb
84.2 cMesoSEb
78.4
MicroSEb
57.5 MicroSEb
57.5