

3.2.1 Simple Tests
These techniques offer an array of simple methods that can be used to determine if
data follows regular patterns or is contained within certain thresholds. Examples of
these techniques include (Fig. 6):
(a) Special value detection (zero, flagged values), where faulty data is identified
based on a pre-set special value, which acts as a flag. This typically happens
when a sensor fails to register a valid value (e.g. due to power failure or
maintenance downtime) and logs data such as ‘Null’, ‘-9999’ or, in some
cases, 0, which can be then easily tracked.
(b) Flat line detection, where groups of consecutive constant (zero or non-zero) data
are identified and flagged as suspicious. Flat line detection can be used for
multiple purposes, as a tool for the detection of gaps in the data or for determining constant values which tend to be very rare inside a water distribution network
(WDN), especially if the time series are characterized by periodic patterns. The
definition of the time window and duration for a flat value test is problemspecific, requiring fine-tuning for each variable and each sensor [40].
(c) Boundary detection (minimum and maximum threshold detection), where data
that exceeds certain (pre-set) minimum and/or maximum thresholds is flagged as
suspicious. In water systems, this analysis is often based on geometric, hydraulic
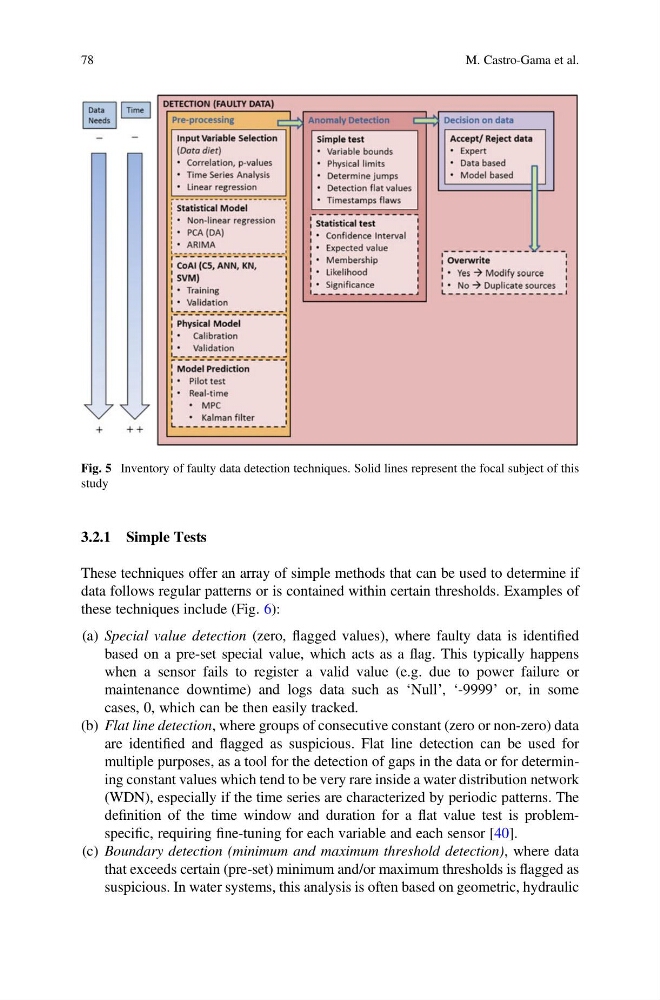
Fig. 5 Inventory of faulty data detection techniques. Solid lines represent the focal subject of this
study
78
M. Castro-Gama et al.
These techniques offer an array of simple methods that can be used to determine if
data follows regular patterns or is contained within certain thresholds. Examples of
these techniques include (Fig. 6):
(a) Special value detection (zero, flagged values), where faulty data is identified
based on a pre-set special value, which acts as a flag. This typically happens
when a sensor fails to register a valid value (e.g. due to power failure or
maintenance downtime) and logs data such as ‘Null’, ‘-9999’ or, in some
cases, 0, which can be then easily tracked.
(b) Flat line detection, where groups of consecutive constant (zero or non-zero) data
are identified and flagged as suspicious. Flat line detection can be used for
multiple purposes, as a tool for the detection of gaps in the data or for determining constant values which tend to be very rare inside a water distribution network
(WDN), especially if the time series are characterized by periodic patterns. The
definition of the time window and duration for a flat value test is problemspecific, requiring fine-tuning for each variable and each sensor [40].
(c) Boundary detection (minimum and maximum threshold detection), where data
that exceeds certain (pre-set) minimum and/or maximum thresholds is flagged as
suspicious. In water systems, this analysis is often based on geometric, hydraulic
Fig. 5 Inventory of faulty data detection techniques. Solid lines represent the focal subject of this
study
78
M. Castro-Gama et al.