

performed using EEM spectroscopy, but its use has been limited to measurement of
discrete samples in static laboratory spectrometers.
5.2.3 Wastewater
Similarly to natural waters, municipal wastewater contains organic matter. A main
role of wastewater treatment plants (WWTPs) is the removal of the majority of this
organic matter. Still, the effluent of a WWTP is a complex mixture of dissolved
effluent organic matter (dE f OM), containing dissolved natural organic matter, soluble microbial products, endocrine disrupting compounds, pharmaceuticals and personal care product residues, disinfection by-products and more. Although current
online sensors are not capable of monitoring the individual components in the
wastewater effluent, it is possible to measure sum parameters. In Sect. 5.1.1 monitoring of BOD and COD using UV/Vis absorption spectroscopy was described.
Fluorescence spectroscopy can also be used to monitor sum parameters, and using
the ratio between characteristic peaks for natural organic matter (humic acids) and
nonnatural organic matter (protein like), sewage contamination of surface waters can
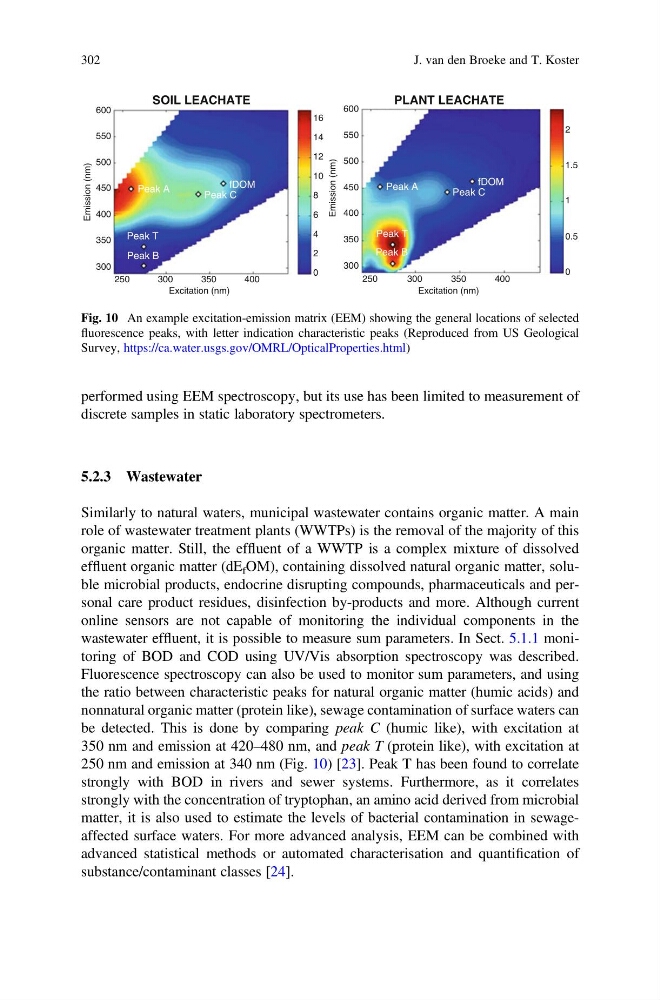
be detected. This is done by comparing peak C (humic like), with excitation at
350 nm and emission at 420–480 nm, and peak T (protein like), with excitation at
250 nm and emission at 340 nm (Fig. 10) [23]. Peak T has been found to correlate
strongly with BOD in rivers and sewer systems. Furthermore, as it correlates
strongly with the concentration of tryptophan, an amino acid derived from microbial
matter, it is also used to estimate the levels of bacterial contamination in sewageaffected surface waters. For more advanced analysis, EEM can be combined with
advanced statistical methods or automated characterisation and quantification of
substance/contaminant classes [24].
SOIL LEACHATE
PLANT LEACHATE
600
550
500
450
400
350
300
250
300
350
400
Excitation (nm)
Emission (nm)
Emission (nm)
Peak T
Peak A
Peak C
fDOM
Peak B
16
14
12
10
8
6
4
2
0
600
550
500
450
400
350
300
250
300
350
400
Excitation (nm)
2
1.5
1
0.5
0
fDOM
Peak C
Peak A
Peak T
Peak B
Fig. 10 An example excitation-emission matrix (EEM) showing the general locations of selected
fluorescence peaks, with letter indication characteristic peaks (Reproduced from US Geological
Survey, https://ca.water.usgs.gov/OMRL/OpticalProperties.html)
302
J. van den Broeke and T. Koster
discrete samples in static laboratory spectrometers.
5.2.3 Wastewater
Similarly to natural waters, municipal wastewater contains organic matter. A main
role of wastewater treatment plants (WWTPs) is the removal of the majority of this
organic matter. Still, the effluent of a WWTP is a complex mixture of dissolved
effluent organic matter (dE f OM), containing dissolved natural organic matter, soluble microbial products, endocrine disrupting compounds, pharmaceuticals and personal care product residues, disinfection by-products and more. Although current
online sensors are not capable of monitoring the individual components in the
wastewater effluent, it is possible to measure sum parameters. In Sect. 5.1.1 monitoring of BOD and COD using UV/Vis absorption spectroscopy was described.
Fluorescence spectroscopy can also be used to monitor sum parameters, and using
the ratio between characteristic peaks for natural organic matter (humic acids) and
nonnatural organic matter (protein like), sewage contamination of surface waters can
be detected. This is done by comparing peak C (humic like), with excitation at
350 nm and emission at 420–480 nm, and peak T (protein like), with excitation at
250 nm and emission at 340 nm (Fig. 10) [23]. Peak T has been found to correlate
strongly with BOD in rivers and sewer systems. Furthermore, as it correlates
strongly with the concentration of tryptophan, an amino acid derived from microbial
matter, it is also used to estimate the levels of bacterial contamination in sewageaffected surface waters. For more advanced analysis, EEM can be combined with
advanced statistical methods or automated characterisation and quantification of
substance/contaminant classes [24].
SOIL LEACHATE
PLANT LEACHATE
600
550
500
450
400
350
300
250
300
350
400
Excitation (nm)
Emission (nm)
Emission (nm)
Peak T
Peak A
Peak C
fDOM
Peak B
16
14
12
10
8
6
4
2
0
600
550
500
450
400
350
300
250
300
350
400
Excitation (nm)
2
1.5
1
0.5
0
fDOM
Peak C
Peak A
Peak T
Peak B
Fig. 10 An example excitation-emission matrix (EEM) showing the general locations of selected
fluorescence peaks, with letter indication characteristic peaks (Reproduced from US Geological
Survey, https://ca.water.usgs.gov/OMRL/OpticalProperties.html)
302
J. van den Broeke and T. Koster