

rapidly changing properties of the medium, such as fluctuations in light reflections
and scattering by air bubbles and particles.
4.2 Transformations
When dealing with raw data that have a low signal to noise ratio, mathematical
transformations can be used to extract useful information. The most widely used
operation for removal of measurement noise is the Fourier transform (FT) [8]. This
utilises the fact that a signal can be represented as a combination of periodic
functions. If the noise and drift on time series data have a significantly different
frequency compared to the signal, they can be filtered out. Typically, low-pass
filtering is used to suppress noise and high-pass filtering to remove drift. Next to
cleaning up the measurement signal, FT is also used in so-called Fourier transform
infrared spectroscopy (FT-IR), a specific method of infrared spectroscopy with a
very good signal to noise ratio and a high wavelength accuracy.
Another operation frequently used to optimise signal to noise ratios and help with
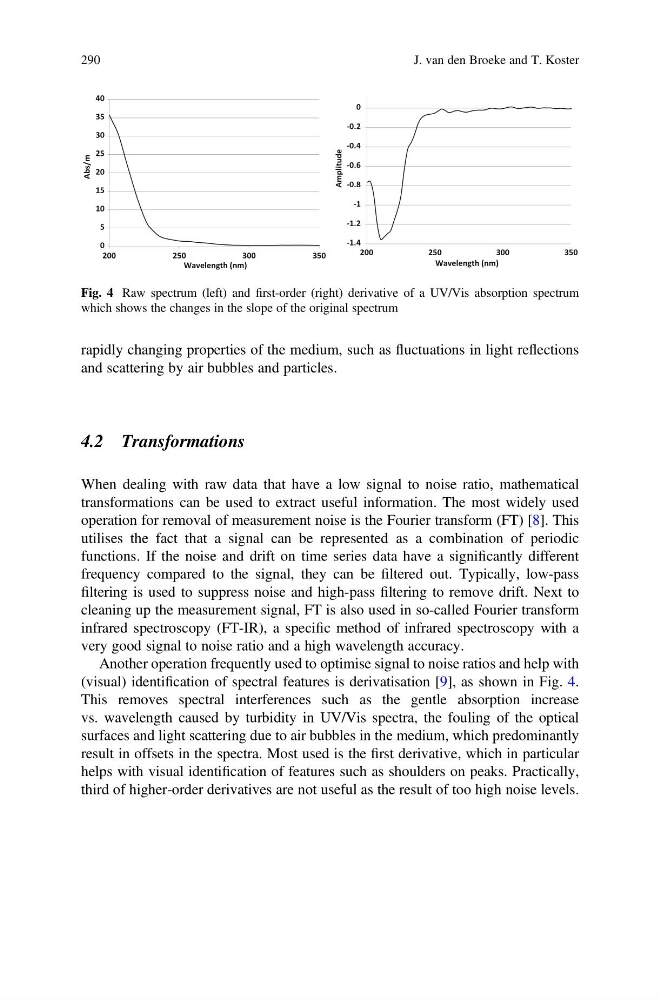
(visual) identification of spectral features is derivatisation [9], as shown in Fig. 4.
This removes spectral interferences such as the gentle absorption increase
vs. wavelength caused by turbidity in UV/Vis spectra, the fouling of the optical
surfaces and light scattering due to air bubbles in the medium, which predominantly
result in offsets in the spectra. Most used is the first derivative, which in particular
helps with visual identification of features such as shoulders on peaks. Practically,
third of higher-order derivatives are not useful as the result of too high noise levels.
0
5
10
15
20
25
30
35
40
200
250
300
350
Abs/m
Wavelength (nm)
-1.4
-1.2
-1
-0.8
-0.6
-0.4
-0.2
0
200
250
300
350
Amplitude
Wavelength (nm)
Fig. 4 Raw spectrum (left) and first-order (right) derivative of a UV/Vis absorption spectrum
which shows the changes in the slope of the original spectrum
290
J. van den Broeke and T. Koster
and scattering by air bubbles and particles.
4.2 Transformations
When dealing with raw data that have a low signal to noise ratio, mathematical
transformations can be used to extract useful information. The most widely used
operation for removal of measurement noise is the Fourier transform (FT) [8]. This
utilises the fact that a signal can be represented as a combination of periodic
functions. If the noise and drift on time series data have a significantly different
frequency compared to the signal, they can be filtered out. Typically, low-pass
filtering is used to suppress noise and high-pass filtering to remove drift. Next to
cleaning up the measurement signal, FT is also used in so-called Fourier transform
infrared spectroscopy (FT-IR), a specific method of infrared spectroscopy with a
very good signal to noise ratio and a high wavelength accuracy.
Another operation frequently used to optimise signal to noise ratios and help with
(visual) identification of spectral features is derivatisation [9], as shown in Fig. 4.
This removes spectral interferences such as the gentle absorption increase
vs. wavelength caused by turbidity in UV/Vis spectra, the fouling of the optical
surfaces and light scattering due to air bubbles in the medium, which predominantly
result in offsets in the spectra. Most used is the first derivative, which in particular
helps with visual identification of features such as shoulders on peaks. Practically,
third of higher-order derivatives are not useful as the result of too high noise levels.
0
5
10
15
20
25
30
35
40
200
250
300
350
Abs/m
Wavelength (nm)
-1.4
-1.2
-1
-0.8
-0.6
-0.4
-0.2
0
200
250
300
350
Amplitude
Wavelength (nm)
Fig. 4 Raw spectrum (left) and first-order (right) derivative of a UV/Vis absorption spectrum
which shows the changes in the slope of the original spectrum
290
J. van den Broeke and T. Koster