

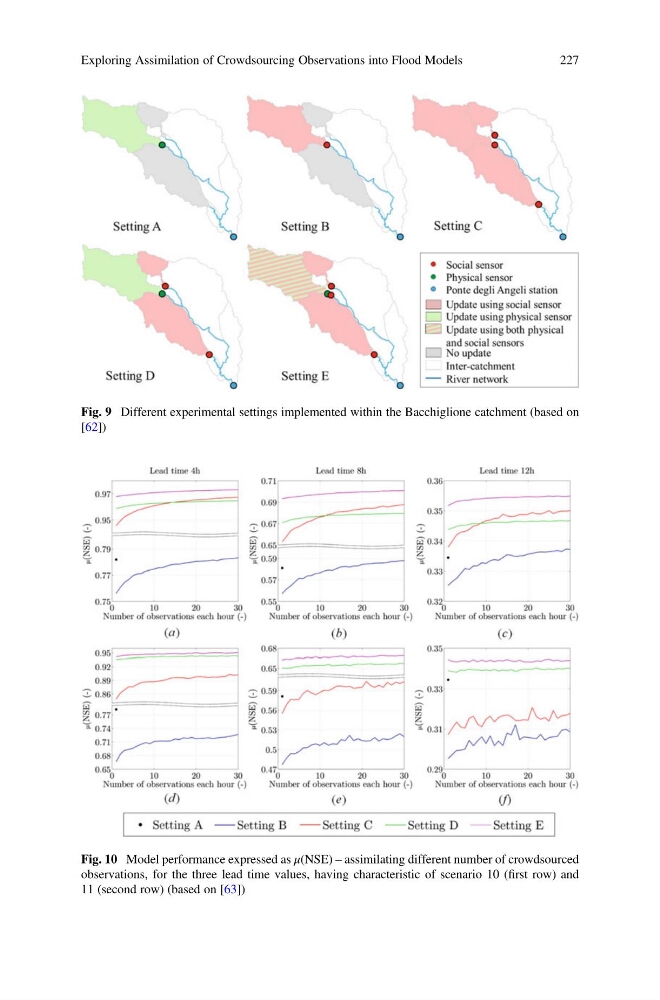
Fig. 9 Different experimental settings implemented within the Bacchiglione catchment (based on
[62])
Fig. 10 Model performance expressed as μ(NSE) – assimilating different number of crowdsourced
observations, for the three lead time values, having characteristic of scenario 10 (first row) and
11 (second row) (based on [63])
Exploring Assimilation of Crowdsourcing Observations into Flood Models
227
[62])
Fig. 10 Model performance expressed as μ(NSE) – assimilating different number of crowdsourced
observations, for the three lead time values, having characteristic of scenario 10 (first row) and
11 (second row) (based on [63])
Exploring Assimilation of Crowdsourcing Observations into Flood Models
227