

depth. In this case, the CS observations have higher degree of uncertainty due to the
indirect method used to estimate water depth value.
According to the nature of the sensor, uncertainty can be defined either as a
probability distribution (quantitative observation) or a fuzzy set (qualitative or semiqualitative observations).
During the last decades, probability theory has been applied in order to represent
epistemic or observational uncertainty in mathematical models. In particular, quantitative observations of physical variables can be expressed as a stochastic variable
with a given probability distribution which represents the likelihood of that variable
value to take on a given value. In most of the cases, stochastic variables are
represented using a normal distribution with assigned mean and standard deviation.
The higher is the standard deviation, the higher the uncertainty of that variable is.
Examples of qualitative information can be found in verbal or text messages
coming from social networks (Twitter, Facebook, etc.). Fuzzy logic emerged as a
more general form of logic that can handle the concept of possibilistic values or
partial truth. This approach has been used recently [64] as a qualitative modelling
methodology since it allows for an easier transition between human and computers
for decision-making (transition from fuzzy to numerical data), and it is able to handle
imprecise and uncertain information [66]. From a statistical point of view, a physical
variable can be associated to a deterministic value plus a given degree of uncertainty,
expressed as a pdf, or the second or third order moment. In fuzzy logic-based
approach, a physical variable value (e.g. precipitation) would belong to a specific
fuzzy set having given characteristic (e.g. low, medium, high precipitation).
3 Case Studies and Water-Related Models
Two different case studies having different hydrometeorological characteristics are
analysed in this book chapter. The case studies are the Brue catchment (UK) and the
Bacchiglione catchment (Italy). Different hydrological and hydraulic models are
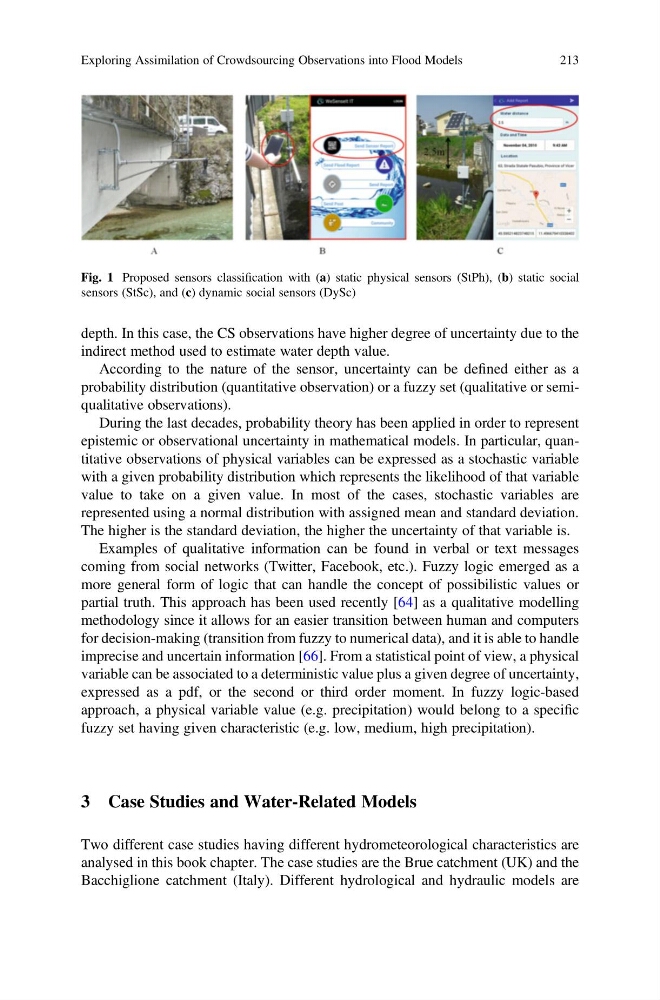
Fig. 1 Proposed sensors classification with (a) static physical sensors (StPh), (b) static social
sensors (StSc), and (c) dynamic social sensors (DySc)
Exploring Assimilation of Crowdsourcing Observations into Flood Models
213
indirect method used to estimate water depth value.
According to the nature of the sensor, uncertainty can be defined either as a
probability distribution (quantitative observation) or a fuzzy set (qualitative or semiqualitative observations).
During the last decades, probability theory has been applied in order to represent
epistemic or observational uncertainty in mathematical models. In particular, quantitative observations of physical variables can be expressed as a stochastic variable
with a given probability distribution which represents the likelihood of that variable
value to take on a given value. In most of the cases, stochastic variables are
represented using a normal distribution with assigned mean and standard deviation.
The higher is the standard deviation, the higher the uncertainty of that variable is.
Examples of qualitative information can be found in verbal or text messages
coming from social networks (Twitter, Facebook, etc.). Fuzzy logic emerged as a
more general form of logic that can handle the concept of possibilistic values or
partial truth. This approach has been used recently [64] as a qualitative modelling
methodology since it allows for an easier transition between human and computers
for decision-making (transition from fuzzy to numerical data), and it is able to handle
imprecise and uncertain information [66]. From a statistical point of view, a physical
variable can be associated to a deterministic value plus a given degree of uncertainty,
expressed as a pdf, or the second or third order moment. In fuzzy logic-based
approach, a physical variable value (e.g. precipitation) would belong to a specific
fuzzy set having given characteristic (e.g. low, medium, high precipitation).
3 Case Studies and Water-Related Models
Two different case studies having different hydrometeorological characteristics are
analysed in this book chapter. The case studies are the Brue catchment (UK) and the
Bacchiglione catchment (Italy). Different hydrological and hydraulic models are
Fig. 1 Proposed sensors classification with (a) static physical sensors (StPh), (b) static social
sensors (StSc), and (c) dynamic social sensors (DySc)
Exploring Assimilation of Crowdsourcing Observations into Flood Models
213