

2 RBF: Structure and Basic Description
A simple RBF can be mathematically described by Eq. (1). The function refers to a
single dimension function which has two parameters. The first is the distance of the
value of x from a constant value depicted by μ. And the other one is a scale factor
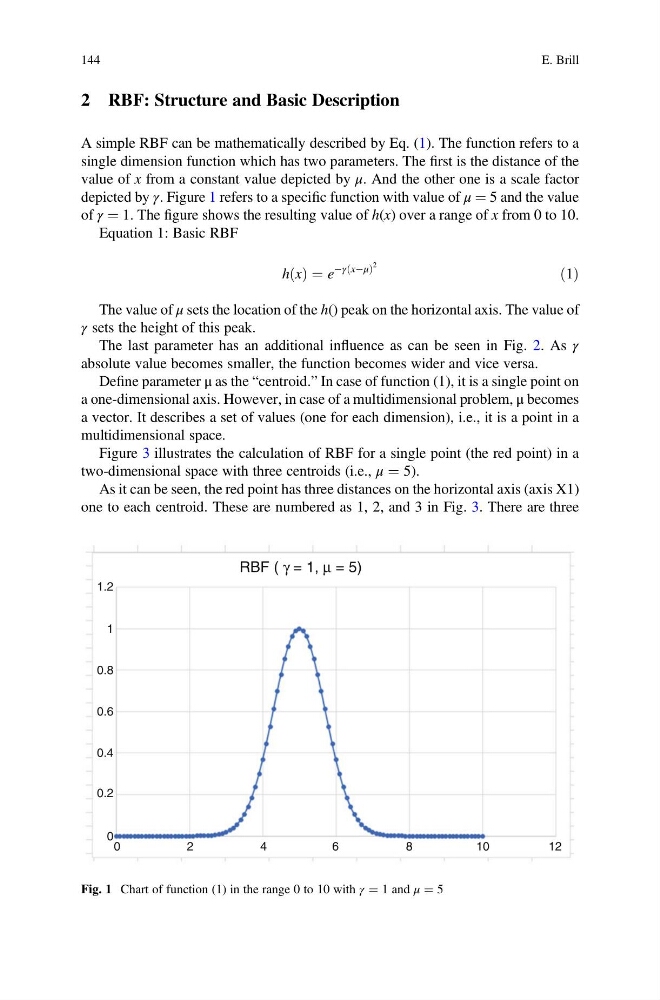
depicted by γ. Figure 1 refers to a specific function with value of μ ¼ 5 and the value
of γ ¼ 1. The figure shows the resulting value of h(x) over a range of x from 0 to 10.
Equation 1: Basic RBF
h x
ð Þ ¼ e
Àγ xÀμ
ð
Þ
2
ð1Þ
The value of μ sets the location of the h() peak on the horizontal axis. The value of
γ sets the height of this peak.
The last parameter has an additional influence as can be seen in Fig. 2. As γ
absolute value becomes smaller, the function becomes wider and vice versa.
Define parameter μ as the “centroid.” In case of function (1), it is a single point on
a one-dimensional axis. However, in case of a multidimensional problem, μ becomes
a vector. It describes a set of values (one for each dimension), i.e., it is a point in a
multidimensional space.
Figure 3 illustrates the calculation of RBF for a single point (the red point) in a
two-dimensional space with three centroids (i.e., μ ¼ 5).
As it can be seen, the red point has three distances on the horizontal axis (axis X1)
one to each centroid. These are numbered as 1, 2, and 3 in Fig. 3. There are three
0.2
0
0
2
4
6
8
1 0
1 2
0.4
0.6
0.8
1
1.2
RBF ( γ = 1, μ = 5)
Fig. 1 Chart of function (1) in the range 0 to 10 with γ ¼ 1 and μ ¼ 5
144
E. Brill
A simple RBF can be mathematically described by Eq. (1). The function refers to a
single dimension function which has two parameters. The first is the distance of the
value of x from a constant value depicted by μ. And the other one is a scale factor
depicted by γ. Figure 1 refers to a specific function with value of μ ¼ 5 and the value
of γ ¼ 1. The figure shows the resulting value of h(x) over a range of x from 0 to 10.
Equation 1: Basic RBF
h x
ð Þ ¼ e
Àγ xÀμ
ð
Þ
2
ð1Þ
The value of μ sets the location of the h() peak on the horizontal axis. The value of
γ sets the height of this peak.
The last parameter has an additional influence as can be seen in Fig. 2. As γ
absolute value becomes smaller, the function becomes wider and vice versa.
Define parameter μ as the “centroid.” In case of function (1), it is a single point on
a one-dimensional axis. However, in case of a multidimensional problem, μ becomes
a vector. It describes a set of values (one for each dimension), i.e., it is a point in a
multidimensional space.
Figure 3 illustrates the calculation of RBF for a single point (the red point) in a
two-dimensional space with three centroids (i.e., μ ¼ 5).
As it can be seen, the red point has three distances on the horizontal axis (axis X1)
one to each centroid. These are numbered as 1, 2, and 3 in Fig. 3. There are three
0.2
0
0
2
4
6
8
1 0
1 2
0.4
0.6
0.8
1
1.2
RBF ( γ = 1, μ = 5)
Fig. 1 Chart of function (1) in the range 0 to 10 with γ ¼ 1 and μ ¼ 5
144
E. Brill