

79
have been interpreted to indicate areas where diazotrophy may have exploited
excess P for growth.
Similarly, natural isotopic signatures of N in nitrate integrated over time and
space can also be used to infer integrated rates of N 2 fixation and denitrification. In
contrast to tracer methods, the natural abundance approach exploits the tendency of
many enzymatic reactions to naturally discriminate against the heavier isotope of an
atom, such as
15
N. Thus, where isotopic discrimination is strong, products of the
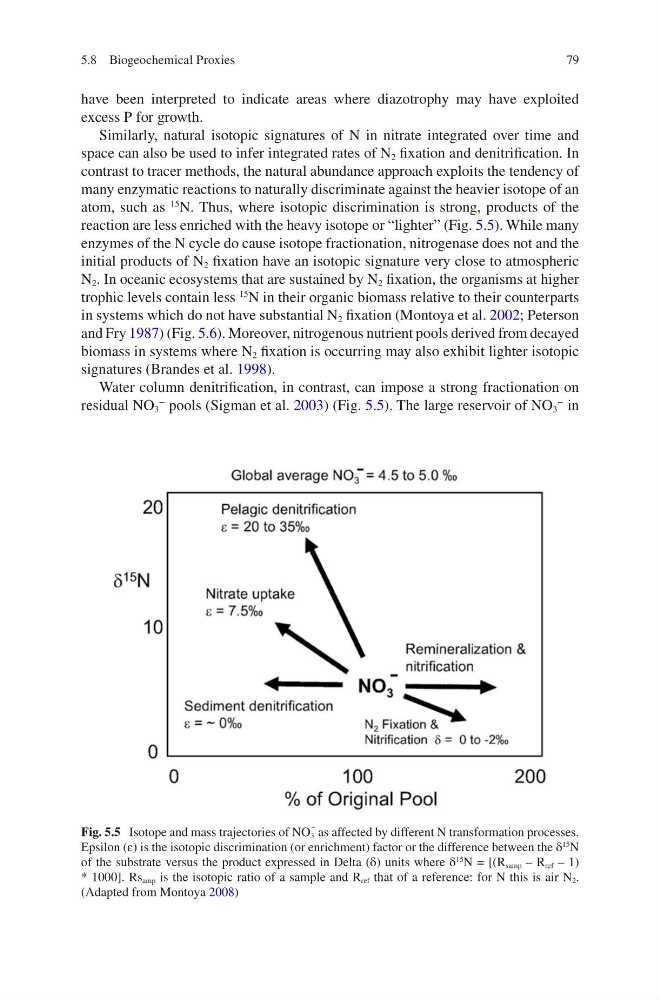
reaction are less enriched with the heavy isotope or “lighter” (Fig. 5.5). While many
enzymes of the N cycle do cause isotope fractionation, nitrogenase does not and the
initial products of N 2 fixation have an isotopic signature very close to atmospheric
N 2 . In oceanic ecosystems that are sustained by N 2 fixation, the organisms at higher
trophic levels contain less
15
N in their organic biomass relative to their counterparts
in systems which do not have substantial N 2 fixation (Montoya et al. 2002; Peterson
and Fry 1987) (Fig. 5.6). Moreover, nitrogenous nutrient pools derived from decayed
biomass in systems where N 2 fixation is occurring may also exhibit lighter isotopic
signatures (Brandes et al. 1998).
Water column denitrification, in contrast, can impose a strong fractionation on
residual NO 3
−
pools (Sigman et al. 2003) (Fig. 5.5). The large reservoir of NO 3
−
in
Fig. 5.5 Isotope and mass trajectories of NO 3
- as affected by different N transformation processes.
Epsilon (ε) is the isotopic discrimination (or enrichment) factor or the difference between the δ
15 N
of the substrate versus the product expressed in Delta (δ) units where δ
15
N = [(R samp – R ref – 1)
* 1000]. Rs amp is the isotopic ratio of a sample and R ref that of a reference: for N this is air N 2 .
(Adapted from Montoya 2008)
5.8 Biogeochemical Proxies
have been interpreted to indicate areas where diazotrophy may have exploited
excess P for growth.
Similarly, natural isotopic signatures of N in nitrate integrated over time and
space can also be used to infer integrated rates of N 2 fixation and denitrification. In
contrast to tracer methods, the natural abundance approach exploits the tendency of
many enzymatic reactions to naturally discriminate against the heavier isotope of an
atom, such as
15
N. Thus, where isotopic discrimination is strong, products of the
reaction are less enriched with the heavy isotope or “lighter” (Fig. 5.5). While many
enzymes of the N cycle do cause isotope fractionation, nitrogenase does not and the
initial products of N 2 fixation have an isotopic signature very close to atmospheric
N 2 . In oceanic ecosystems that are sustained by N 2 fixation, the organisms at higher
trophic levels contain less
15
N in their organic biomass relative to their counterparts
in systems which do not have substantial N 2 fixation (Montoya et al. 2002; Peterson
and Fry 1987) (Fig. 5.6). Moreover, nitrogenous nutrient pools derived from decayed
biomass in systems where N 2 fixation is occurring may also exhibit lighter isotopic
signatures (Brandes et al. 1998).
Water column denitrification, in contrast, can impose a strong fractionation on
residual NO 3
−
pools (Sigman et al. 2003) (Fig. 5.5). The large reservoir of NO 3
−
in
Fig. 5.5 Isotope and mass trajectories of NO 3
- as affected by different N transformation processes.
Epsilon (ε) is the isotopic discrimination (or enrichment) factor or the difference between the δ
15 N
of the substrate versus the product expressed in Delta (δ) units where δ
15
N = [(R samp – R ref – 1)
* 1000]. Rs amp is the isotopic ratio of a sample and R ref that of a reference: for N this is air N 2 .
(Adapted from Montoya 2008)
5.8 Biogeochemical Proxies