

composition of the meals. To estimate the carotenoid intake in
the designed meals, the European carotenoid database is used
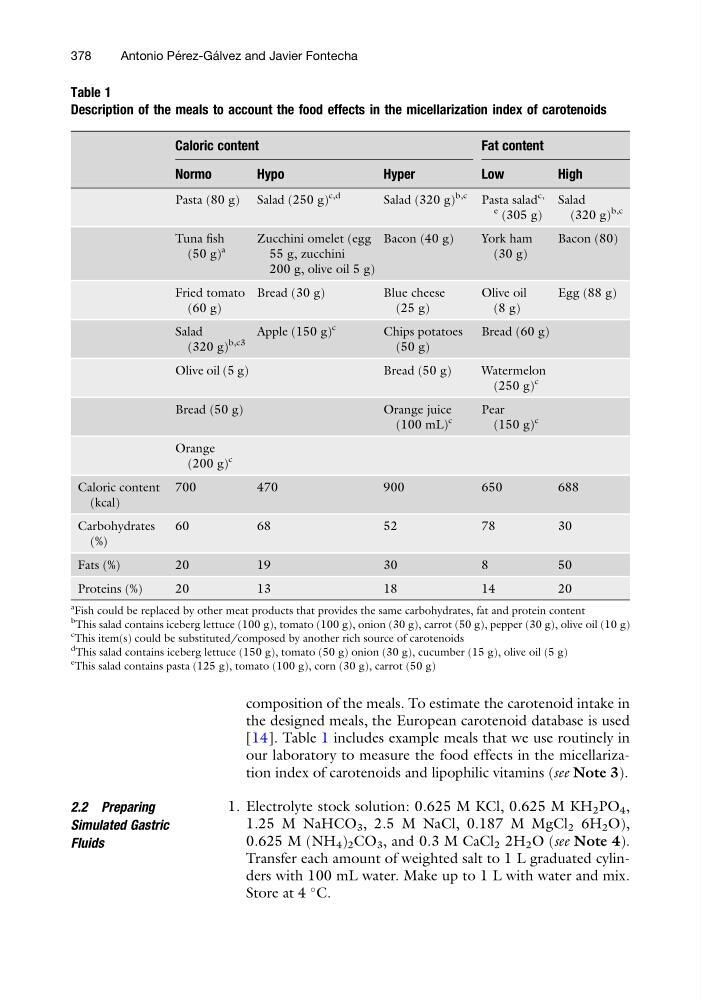
[14]. Table 1 includes example meals that we use routinely in
our laboratory to measure the food effects in the micellarization index of carotenoids and lipophilic vitamins (see Note 3).
2.2 Preparing
Simulated Gastric
Fluids
1. Electrolyte stock solution: 0.625 M KCl, 0.625 M KH 2 PO 4 ,
1.25 M NaHCO 3 , 2.5 M NaCl, 0.187 M MgCl 2 6H 2 O),
0.625 M (NH 4 ) 2 CO 3 , and 0.3 M CaCl 2 2H 2 O (see Note 4).
Transfer each amount of weighted salt to 1 L graduated cylinders with 100 mL water. Make up to 1 L with water and mix.
Store at 4
C.
Table 1
Description of the meals to account the food effects in the micellarization index of carotenoids
Caloric content
Fat content
Normo
Hypo
Hyper
Low
High
Pasta (80 g) Salad (250 g)
c,d
Salad (320 g)
b,c
Pasta salad
c,
e (305 g)
Salad
(320 g)
b,c
Tuna fish
(50 g)
a
Zucchini omelet (egg
55 g, zucchini
200 g, olive oil 5 g)
Bacon (40 g)
York ham
(30 g)
Bacon (80)
Fried tomato
(60 g)
Bread (30 g)
Blue cheese
(25 g)
Olive oil
(8 g)
Egg (88 g)
Salad
(320 g)
b,c3
Apple (150 g)
c
Chips potatoes
(50 g)
Bread (60 g)
Olive oil (5 g)
Bread (50 g)
Watermelon
(250 g)
c
Bread (50 g)
Orange juice
(100 mL)
c
Pear
(150 g)
c
Orange
(200 g)
c
Caloric content
(kcal)
700
470
900
650
688
Carbohydrates
(%)
60
68
52
78
30
Fats (%)
20
19
30
8
50
Proteins (%)
20
13
18
14
20
a
Fish could be replaced by other meat products that provides the same carbohydrates, fat and protein content
b
This salad contains iceberg lettuce (100 g), tomato (100 g), onion (30 g), carrot (50 g), pepper (30 g), olive oil (10 g)
c
This item(s) could be substituted/composed by another rich source of carotenoids
d
This salad contains iceberg lettuce (150 g), tomato (50 g) onion (30 g), cucumber (15 g), olive oil (5 g)
e
This salad contains pasta (125 g), tomato (100 g), corn (30 g), carrot (50 g)
378
Antonio Pe ´ rez-Ga ´ lvez and Javier Fontecha
the designed meals, the European carotenoid database is used
[14]. Table 1 includes example meals that we use routinely in
our laboratory to measure the food effects in the micellarization index of carotenoids and lipophilic vitamins (see Note 3).
2.2 Preparing
Simulated Gastric
Fluids
1. Electrolyte stock solution: 0.625 M KCl, 0.625 M KH 2 PO 4 ,
1.25 M NaHCO 3 , 2.5 M NaCl, 0.187 M MgCl 2 6H 2 O),
0.625 M (NH 4 ) 2 CO 3 , and 0.3 M CaCl 2 2H 2 O (see Note 4).
Transfer each amount of weighted salt to 1 L graduated cylinders with 100 mL water. Make up to 1 L with water and mix.
Store at 4
C.
Table 1
Description of the meals to account the food effects in the micellarization index of carotenoids
Caloric content
Fat content
Normo
Hypo
Hyper
Low
High
Pasta (80 g) Salad (250 g)
c,d
Salad (320 g)
b,c
Pasta salad
c,
e (305 g)
Salad
(320 g)
b,c
Tuna fish
(50 g)
a
Zucchini omelet (egg
55 g, zucchini
200 g, olive oil 5 g)
Bacon (40 g)
York ham
(30 g)
Bacon (80)
Fried tomato
(60 g)
Bread (30 g)
Blue cheese
(25 g)
Olive oil
(8 g)
Egg (88 g)
Salad
(320 g)
b,c3
Apple (150 g)
c
Chips potatoes
(50 g)
Bread (60 g)
Olive oil (5 g)
Bread (50 g)
Watermelon
(250 g)
c
Bread (50 g)
Orange juice
(100 mL)
c
Pear
(150 g)
c
Orange
(200 g)
c
Caloric content
(kcal)
700
470
900
650
688
Carbohydrates
(%)
60
68
52
78
30
Fats (%)
20
19
30
8
50
Proteins (%)
20
13
18
14
20
a
Fish could be replaced by other meat products that provides the same carbohydrates, fat and protein content
b
This salad contains iceberg lettuce (100 g), tomato (100 g), onion (30 g), carrot (50 g), pepper (30 g), olive oil (10 g)
c
This item(s) could be substituted/composed by another rich source of carotenoids
d
This salad contains iceberg lettuce (150 g), tomato (50 g) onion (30 g), cucumber (15 g), olive oil (5 g)
e
This salad contains pasta (125 g), tomato (100 g), corn (30 g), carrot (50 g)
378
Antonio Pe ´ rez-Ga ´ lvez and Javier Fontecha