

3. For Raman imaging select additionally the size of samples to be
imaged and sampling density (see Note 24). The scheme of
Raman imaging measurement is presented in Fig. 2b, c.
4. Optimize all the parameters (see Note 25) and perform measurement. If necessary, repeat the measurements by choosing
the same area within a sample and optimize the measurement
condition.
5. Read the band positions and assign the bands in single Raman
spectra of carotenoids (see Note 26) (Fig. 3a).
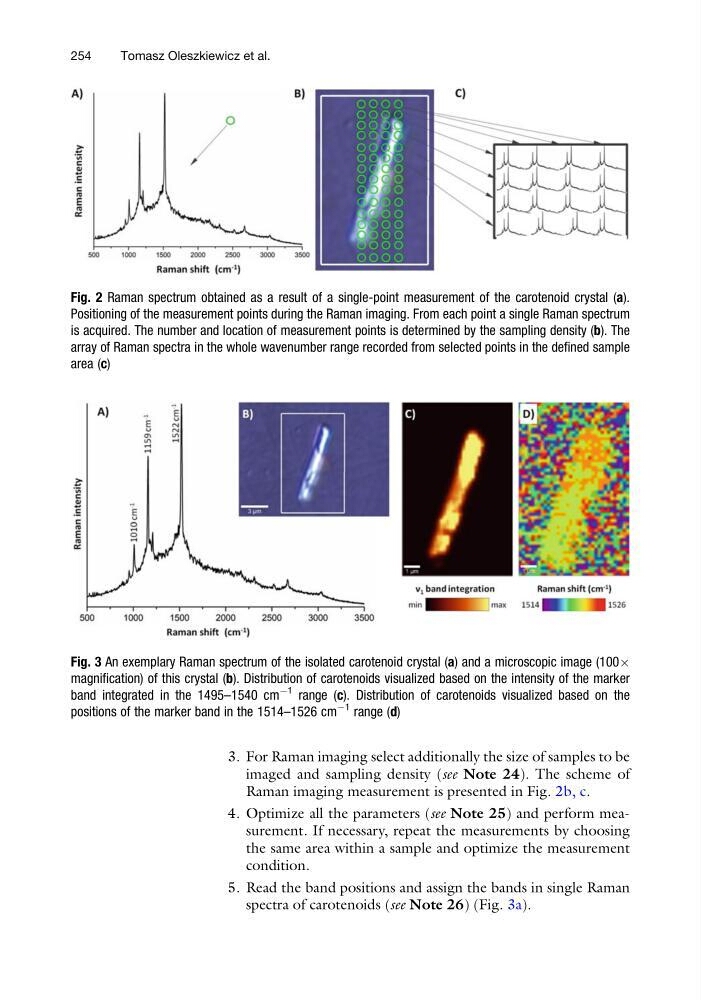
Fig. 2 Raman spectrum obtained as a result of a single-point measurement of the carotenoid crystal (a).
Positioning of the measurement points during the Raman imaging. From each point a single Raman spectrum
is acquired. The number and location of measurement points is determined by the sampling density (b). The
array of Raman spectra in the whole wavenumber range recorded from selected points in the defined sample
area (c)
Fig. 3 An exemplary Raman spectrum of the isolated carotenoid crystal (a) and a microscopic image (100Â
magnification) of this crystal (b). Distribution of carotenoids visualized based on the intensity of the marker
band integrated in the 1495–1540 cm
À1 range (c). Distribution of carotenoids visualized based on the
positions of the marker band in the 1514–1526 cm
À1 range (d)
254
Tomasz Oleszkiewicz et al.
imaged and sampling density (see Note 24). The scheme of
Raman imaging measurement is presented in Fig. 2b, c.
4. Optimize all the parameters (see Note 25) and perform measurement. If necessary, repeat the measurements by choosing
the same area within a sample and optimize the measurement
condition.
5. Read the band positions and assign the bands in single Raman
spectra of carotenoids (see Note 26) (Fig. 3a).
Fig. 2 Raman spectrum obtained as a result of a single-point measurement of the carotenoid crystal (a).
Positioning of the measurement points during the Raman imaging. From each point a single Raman spectrum
is acquired. The number and location of measurement points is determined by the sampling density (b). The
array of Raman spectra in the whole wavenumber range recorded from selected points in the defined sample
area (c)
Fig. 3 An exemplary Raman spectrum of the isolated carotenoid crystal (a) and a microscopic image (100Â
magnification) of this crystal (b). Distribution of carotenoids visualized based on the intensity of the marker
band integrated in the 1495–1540 cm
À1 range (c). Distribution of carotenoids visualized based on the
positions of the marker band in the 1514–1526 cm
À1 range (d)
254
Tomasz Oleszkiewicz et al.