

36
O. Mahjoub et al.
-5
0
5
10
15
20
25
0
0.5
1
1.5
2
2.5
3
3.5
4
4.5
5
Jan Feb Mar Apr May Jun
Jul
Aug Sep Oct Nov Dec
Tempertaure (°C)
Temperature
Precipitation
Precipitation anaomaly (mm)
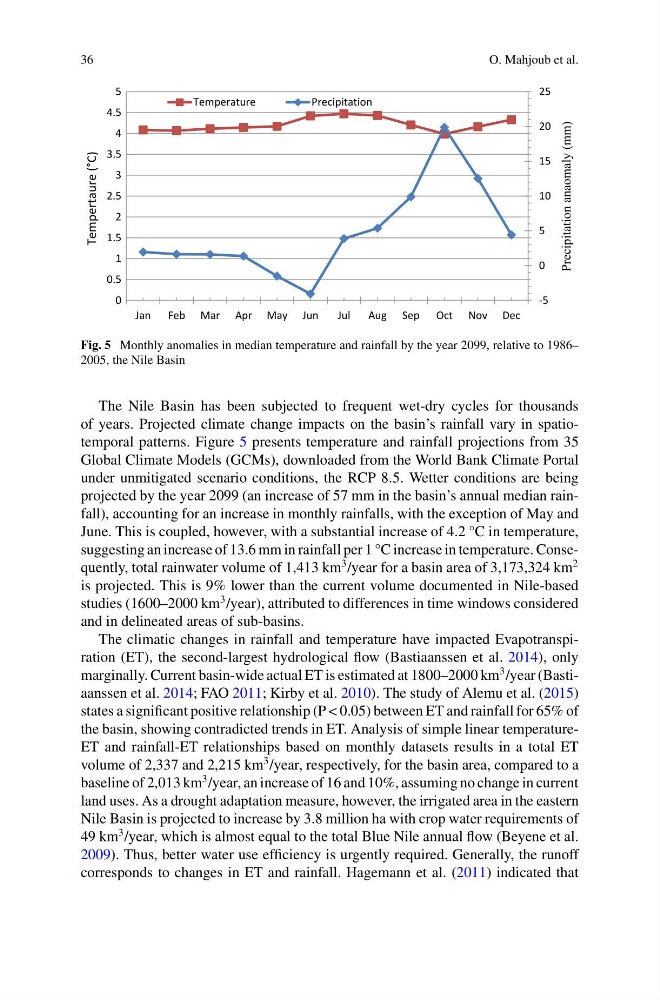
Fig. 5 Monthly anomalies in median temperature and rainfall by the year 2099, relative to 1986–
2005, the Nile Basin
The Nile Basin has been subjected to frequent wet-dry cycles for thousands
of years. Projected climate change impacts on the basin’s rainfall vary in spatiotemporal patterns. Figure 5 presents temperature and rainfall projections from 35
Global Climate Models (GCMs), downloaded from the World Bank Climate Portal
under unmitigated scenario conditions, the RCP 8.5. Wetter conditions are being
projected by the year 2099 (an increase of 57 mm in the basin’s annual median rainfall), accounting for an increase in monthly rainfalls, with the exception of May and
June. This is coupled, however, with a substantial increase of 4.2 °C in temperature,
suggesting an increase of 13.6 mm in rainfall per 1 °C increase in temperature. Consequently, total rainwater volume of 1,413 km
3 /year for a basin area of 3,173,324 km
2
is projected. This is 9% lower than the current volume documented in Nile-based
studies (1600–2000 km
3 /year), attributed to differences in time windows considered
and in delineated areas of sub-basins.
The climatic changes in rainfall and temperature have impacted Evapotranspiration (ET), the second-largest hydrological flow (Bastiaanssen et al. 2014), only
marginally. Current basin-wide actual ET is estimated at 1800–2000 km
3 /year (Bastiaanssen et al. 2014; FAO 2011; Kirby et al. 2010). The study of Alemu et al. (2015)
states a significant positive relationship (P < 0.05) between ET and rainfall for 65% of
the basin, showing contradicted trends in ET. Analysis of simple linear temperatureET and rainfall-ET relationships based on monthly datasets results in a total ET
volume of 2,337 and 2,215 km
3 /year, respectively, for the basin area, compared to a
baseline of 2,013 km
3 /year, an increase of 16 and 10%, assuming no change in current
land uses. As a drought adaptation measure, however, the irrigated area in the eastern
Nile Basin is projected to increase by 3.8 million ha with crop water requirements of
49 km
3 /year, which is almost equal to the total Blue Nile annual flow (Beyene et al.
2009). Thus, better water use efficiency is urgently required. Generally, the runoff
corresponds to changes in ET and rainfall. Hagemann et al. (2011) indicated that
O. Mahjoub et al.
-5
0
5
10
15
20
25
0
0.5
1
1.5
2
2.5
3
3.5
4
4.5
5
Jan Feb Mar Apr May Jun
Jul
Aug Sep Oct Nov Dec
Tempertaure (°C)
Temperature
Precipitation
Precipitation anaomaly (mm)
Fig. 5 Monthly anomalies in median temperature and rainfall by the year 2099, relative to 1986–
2005, the Nile Basin
The Nile Basin has been subjected to frequent wet-dry cycles for thousands
of years. Projected climate change impacts on the basin’s rainfall vary in spatiotemporal patterns. Figure 5 presents temperature and rainfall projections from 35
Global Climate Models (GCMs), downloaded from the World Bank Climate Portal
under unmitigated scenario conditions, the RCP 8.5. Wetter conditions are being
projected by the year 2099 (an increase of 57 mm in the basin’s annual median rainfall), accounting for an increase in monthly rainfalls, with the exception of May and
June. This is coupled, however, with a substantial increase of 4.2 °C in temperature,
suggesting an increase of 13.6 mm in rainfall per 1 °C increase in temperature. Consequently, total rainwater volume of 1,413 km
3 /year for a basin area of 3,173,324 km
2
is projected. This is 9% lower than the current volume documented in Nile-based
studies (1600–2000 km
3 /year), attributed to differences in time windows considered
and in delineated areas of sub-basins.
The climatic changes in rainfall and temperature have impacted Evapotranspiration (ET), the second-largest hydrological flow (Bastiaanssen et al. 2014), only
marginally. Current basin-wide actual ET is estimated at 1800–2000 km
3 /year (Bastiaanssen et al. 2014; FAO 2011; Kirby et al. 2010). The study of Alemu et al. (2015)
states a significant positive relationship (P < 0.05) between ET and rainfall for 65% of
the basin, showing contradicted trends in ET. Analysis of simple linear temperatureET and rainfall-ET relationships based on monthly datasets results in a total ET
volume of 2,337 and 2,215 km
3 /year, respectively, for the basin area, compared to a
baseline of 2,013 km
3 /year, an increase of 16 and 10%, assuming no change in current
land uses. As a drought adaptation measure, however, the irrigated area in the eastern
Nile Basin is projected to increase by 3.8 million ha with crop water requirements of
49 km
3 /year, which is almost equal to the total Blue Nile annual flow (Beyene et al.
2009). Thus, better water use efficiency is urgently required. Generally, the runoff
corresponds to changes in ET and rainfall. Hagemann et al. (2011) indicated that