

444
M. C. Moseki
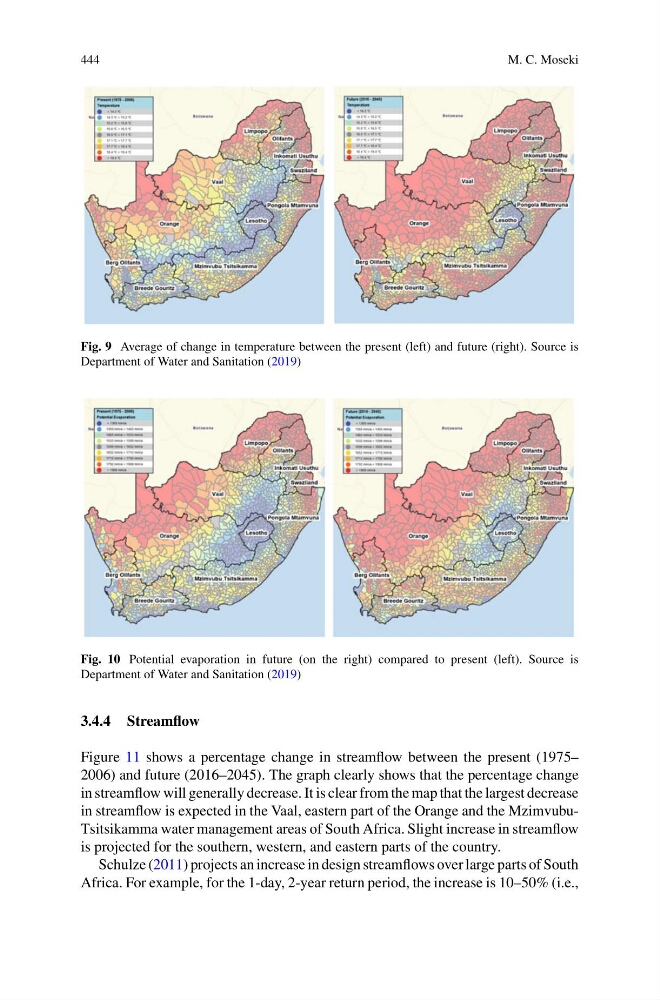
Fig. 9 Average of change in temperature between the present (left) and future (right). Source is
Department of Water and Sanitation (2019)
Fig. 10 Potential evaporation in future (on the right) compared to present (left). Source is
Department of Water and Sanitation (2019)
3.4.4 Streamflow
Figure 11 shows a percentage change in streamflow between the present (1975–
2006) and future (2016–2045). The graph clearly shows that the percentage change
in streamflow will generally decrease. It is clear from the map that the largest decrease
in streamflow is expected in the Vaal, eastern part of the Orange and the MzimvubuTsitsikamma water management areas of South Africa. Slight increase in streamflow
is projected for the southern, western, and eastern parts of the country.
Schulze (2011) projects an increase in design streamflows over large parts of South
Africa. For example, for the 1-day, 2-year return period, the increase is 10–50% (i.e.,
M. C. Moseki
Fig. 9 Average of change in temperature between the present (left) and future (right). Source is
Department of Water and Sanitation (2019)
Fig. 10 Potential evaporation in future (on the right) compared to present (left). Source is
Department of Water and Sanitation (2019)
3.4.4 Streamflow
Figure 11 shows a percentage change in streamflow between the present (1975–
2006) and future (2016–2045). The graph clearly shows that the percentage change
in streamflow will generally decrease. It is clear from the map that the largest decrease
in streamflow is expected in the Vaal, eastern part of the Orange and the MzimvubuTsitsikamma water management areas of South Africa. Slight increase in streamflow
is projected for the southern, western, and eastern parts of the country.
Schulze (2011) projects an increase in design streamflows over large parts of South
Africa. For example, for the 1-day, 2-year return period, the increase is 10–50% (i.e.,