

13 Assessment of Hydrological Impacts …
299
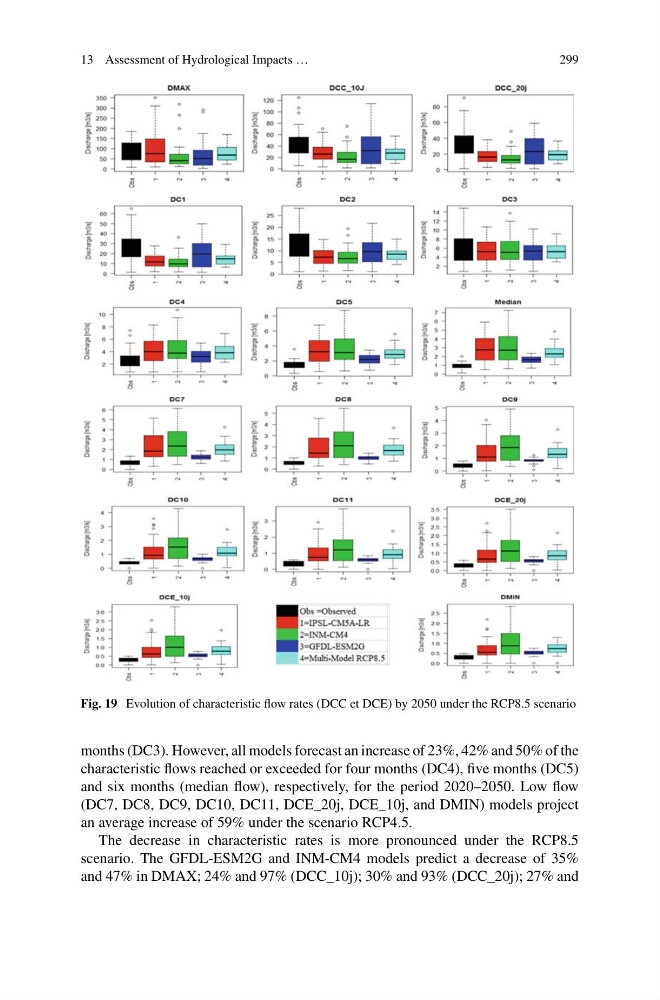
Fig. 19 Evolution of characteristic flow rates (DCC et DCE) by 2050 under the RCP8.5 scenario
months (DC3). However, all models forecast an increase of 23%, 42% and 50% of the
characteristic flows reached or exceeded for four months (DC4), five months (DC5)
and six months (median flow), respectively, for the period 2020–2050. Low flow
(DC7, DC8, DC9, DC10, DC11, DCE_20j, DCE_10j, and DMIN) models project
an average increase of 59% under the scenario RCP4.5.
The decrease in characteristic rates is more pronounced under the RCP8.5
scenario. The GFDL-ESM2G and INM-CM4 models predict a decrease of 35%
and 47% in DMAX; 24% and 97% (DCC_10j); 30% and 93% (DCC_20j); 27% and
299
Fig. 19 Evolution of characteristic flow rates (DCC et DCE) by 2050 under the RCP8.5 scenario
months (DC3). However, all models forecast an increase of 23%, 42% and 50% of the
characteristic flows reached or exceeded for four months (DC4), five months (DC5)
and six months (median flow), respectively, for the period 2020–2050. Low flow
(DC7, DC8, DC9, DC10, DC11, DCE_20j, DCE_10j, and DMIN) models project
an average increase of 59% under the scenario RCP4.5.
The decrease in characteristic rates is more pronounced under the RCP8.5
scenario. The GFDL-ESM2G and INM-CM4 models predict a decrease of 35%
and 47% in DMAX; 24% and 97% (DCC_10j); 30% and 93% (DCC_20j); 27% and