

280
I. Thiaw et al.
2.2 Data and Tools
2.2.1 Observed Data
The observed data (temperatures and daily rains) used in this study are from the
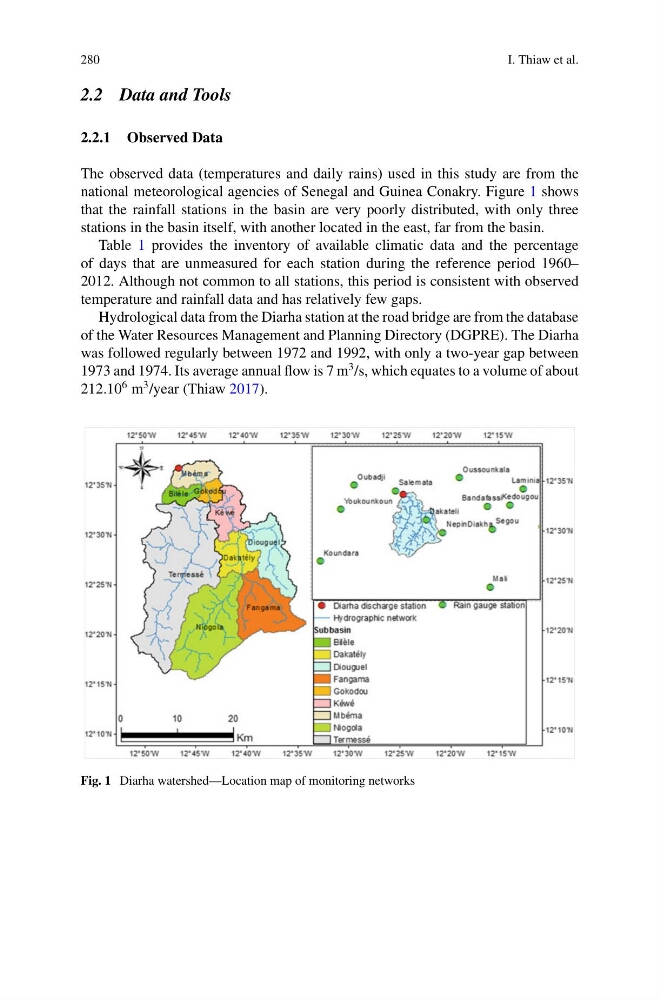
national meteorological agencies of Senegal and Guinea Conakry. Figure 1 shows
that the rainfall stations in the basin are very poorly distributed, with only three
stations in the basin itself, with another located in the east, far from the basin.
Table 1 provides the inventory of available climatic data and the percentage
of days that are unmeasured for each station during the reference period 1960–
2012. Although not common to all stations, this period is consistent with observed
temperature and rainfall data and has relatively few gaps.
Hydrological data from the Diarha station at the road bridge are from the database
of the Water Resources Management and Planning Directory (DGPRE). The Diarha
was followed regularly between 1972 and 1992, with only a two-year gap between
1973 and 1974. Its average annual flow is 7 m
3 /s, which equates to a volume of about
212.10
6 m
3 /year (Thiaw 2017).
Fig. 1 Diarha watershed—Location map of monitoring networks
I. Thiaw et al.
2.2 Data and Tools
2.2.1 Observed Data
The observed data (temperatures and daily rains) used in this study are from the
national meteorological agencies of Senegal and Guinea Conakry. Figure 1 shows
that the rainfall stations in the basin are very poorly distributed, with only three
stations in the basin itself, with another located in the east, far from the basin.
Table 1 provides the inventory of available climatic data and the percentage
of days that are unmeasured for each station during the reference period 1960–
2012. Although not common to all stations, this period is consistent with observed
temperature and rainfall data and has relatively few gaps.
Hydrological data from the Diarha station at the road bridge are from the database
of the Water Resources Management and Planning Directory (DGPRE). The Diarha
was followed regularly between 1972 and 1992, with only a two-year gap between
1973 and 1974. Its average annual flow is 7 m
3 /s, which equates to a volume of about
212.10
6 m
3 /year (Thiaw 2017).
Fig. 1 Diarha watershed—Location map of monitoring networks