

228
J. U. Kitheka et al.
0
10
20
30
40
50
60
70
80
0
2
4
6
8
10
12
1
5
9
13
17
21
25
29
33
37
41
45
49
53
57
61
65
69
73
77
81
85
89
93
97
River Discharge (m/s)
Monthly rainfall (cm)
Months
Rainfall
Discharge
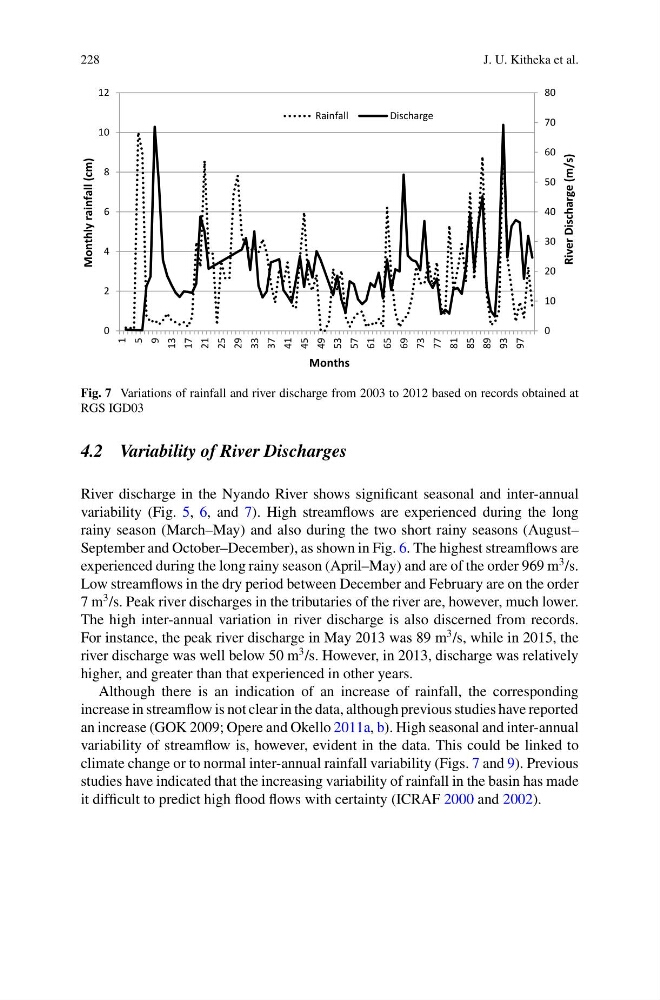
Fig. 7 Variations of rainfall and river discharge from 2003 to 2012 based on records obtained at
RGS IGD03
4.2 Variability of River Discharges
River discharge in the Nyando River shows significant seasonal and inter-annual
variability (Fig. 5, 6, and 7). High streamflows are experienced during the long
rainy season (March–May) and also during the two short rainy seasons (August–
September and October–December), as shown in Fig. 6. The highest streamflows are
experienced during the long rainy season (April–May) and are of the order 969 m
3 /s.
Low streamflows in the dry period between December and February are on the order
7 m
3 /s. Peak river discharges in the tributaries of the river are, however, much lower.
The high inter-annual variation in river discharge is also discerned from records.
For instance, the peak river discharge in May 2013 was 89 m
3 /s, while in 2015, the
river discharge was well below 50 m
3 /s. However, in 2013, discharge was relatively
higher, and greater than that experienced in other years.
Although there is an indication of an increase of rainfall, the corresponding
increase in streamflow is not clear in the data, although previous studies have reported
an increase (GOK 2009; Opere and Okello 2011a, b). High seasonal and inter-annual
variability of streamflow is, however, evident in the data. This could be linked to
climate change or to normal inter-annual rainfall variability (Figs. 7 and 9). Previous
studies have indicated that the increasing variability of rainfall in the basin has made
it difficult to predict high flood flows with certainty (ICRAF 2000 and 2002).
J. U. Kitheka et al.
0
10
20
30
40
50
60
70
80
0
2
4
6
8
10
12
1
5
9
13
17
21
25
29
33
37
41
45
49
53
57
61
65
69
73
77
81
85
89
93
97
River Discharge (m/s)
Monthly rainfall (cm)
Months
Rainfall
Discharge
Fig. 7 Variations of rainfall and river discharge from 2003 to 2012 based on records obtained at
RGS IGD03
4.2 Variability of River Discharges
River discharge in the Nyando River shows significant seasonal and inter-annual
variability (Fig. 5, 6, and 7). High streamflows are experienced during the long
rainy season (March–May) and also during the two short rainy seasons (August–
September and October–December), as shown in Fig. 6. The highest streamflows are
experienced during the long rainy season (April–May) and are of the order 969 m
3 /s.
Low streamflows in the dry period between December and February are on the order
7 m
3 /s. Peak river discharges in the tributaries of the river are, however, much lower.
The high inter-annual variation in river discharge is also discerned from records.
For instance, the peak river discharge in May 2013 was 89 m
3 /s, while in 2015, the
river discharge was well below 50 m
3 /s. However, in 2013, discharge was relatively
higher, and greater than that experienced in other years.
Although there is an indication of an increase of rainfall, the corresponding
increase in streamflow is not clear in the data, although previous studies have reported
an increase (GOK 2009; Opere and Okello 2011a, b). High seasonal and inter-annual
variability of streamflow is, however, evident in the data. This could be linked to
climate change or to normal inter-annual rainfall variability (Figs. 7 and 9). Previous
studies have indicated that the increasing variability of rainfall in the basin has made
it difficult to predict high flood flows with certainty (ICRAF 2000 and 2002).