

9 Lentic-Lotic Water System Response to Anthropogenic …
205
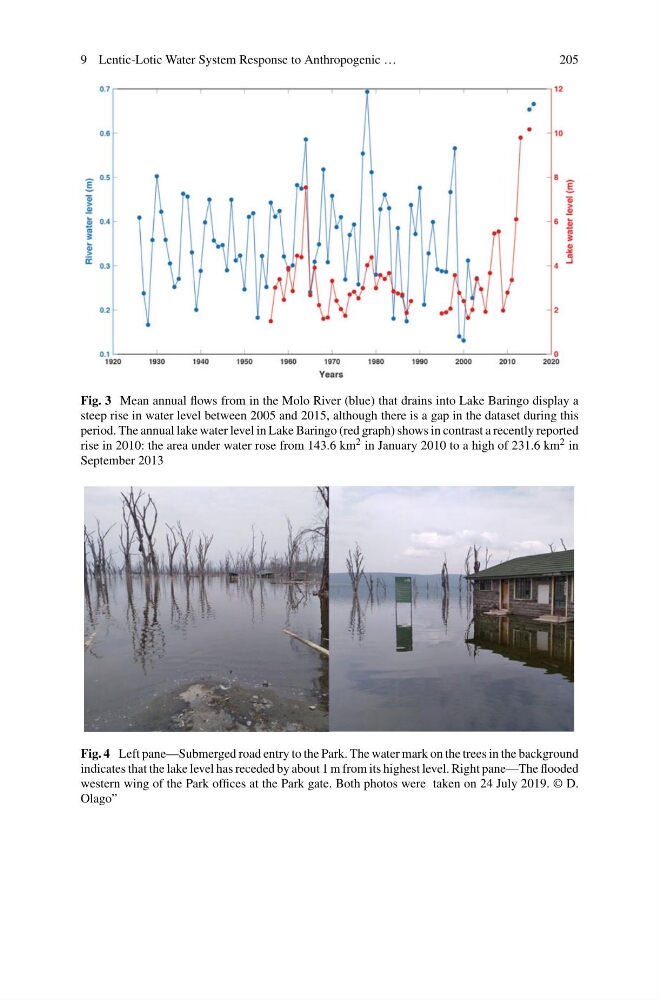
Fig. 3 Mean annual flows from in the Molo River (blue) that drains into Lake Baringo display a
steep rise in water level between 2005 and 2015, although there is a gap in the dataset during this
period. The annual lake water level in Lake Baringo (red graph) shows in contrast a recently reported
rise in 2010: the area under water rose from 143.6 km 2 in January 2010 to a high of 231.6 km 2 in
September 2013
Fig. 4 Left pane—Submerged road entry to the Park. The water mark on the trees in the background
indicates that the lake level has receded by about 1 m from its highest level. Right pane—The flooded
western wing of the Park offices at the Park gate. Both photos were taken on 24 July 2019. © D.
Olago”
205
Fig. 3 Mean annual flows from in the Molo River (blue) that drains into Lake Baringo display a
steep rise in water level between 2005 and 2015, although there is a gap in the dataset during this
period. The annual lake water level in Lake Baringo (red graph) shows in contrast a recently reported
rise in 2010: the area under water rose from 143.6 km 2 in January 2010 to a high of 231.6 km 2 in
September 2013
Fig. 4 Left pane—Submerged road entry to the Park. The water mark on the trees in the background
indicates that the lake level has receded by about 1 m from its highest level. Right pane—The flooded
western wing of the Park offices at the Park gate. Both photos were taken on 24 July 2019. © D.
Olago”