

9 Lentic-Lotic Water System Response to Anthropogenic …
203
tend to rapidly raise lake levels and cause widespread flooding along lakeshores and
rivers (Birkett et al. 1999; Conway 2002). For example, the El Niño phenomenon in
1997–1998 saw water level rise by 1.7 m (Lake Victoria), 2.1 m (Lake Tanganyika),
and 1.8 m (Lake Malawi) (Birkett et al. 1999). The widespread heavy rainfall and
flooding also produced adverse wide-ranging agricultural, hydrological, ecological,
and economic impacts in East Africa (Conway 2002). Further, the consequences of
aquatic ecosystem change and biodiversity resulting from naturally induced changes
in pH, salinity, stratification, sediment, and nutrient load fluctuation due to lake level
changes and rising water temperatures are still not known satisfactorily, yet it is clear
that these factors are strongly compounded by anthropogenic activities.
East Africa is projected to become wetter in some GCMs (Endris et al. 2013;
Masson-Delmotte et al. 2013), with projections of increased September–October–
November (SON) and decreased March–April–May (MAM) rainfall in some models
(Christensen et al. 2013). This is in contrast to observed (instrument-derived) data,
which shows a drying trend. The mismatch between observed and model data in
East Africa is known as the “East African Paradox”: research is ongoing currently to
explain this contradiction (e.g., Rowell et al. 2015). The frequency of intense rainfall
is expected to increase as the planet warms, both over-lake (e.g., Thiery et al. 2016)
and over land (e.g., Kuya 2016). The potential impacts of future climate changes
on Kenya’s water resources for the years 2030 and 2050, with a baseline year of
2010, have been evaluated against Kenya’s National Water Master Plan (NWMP;
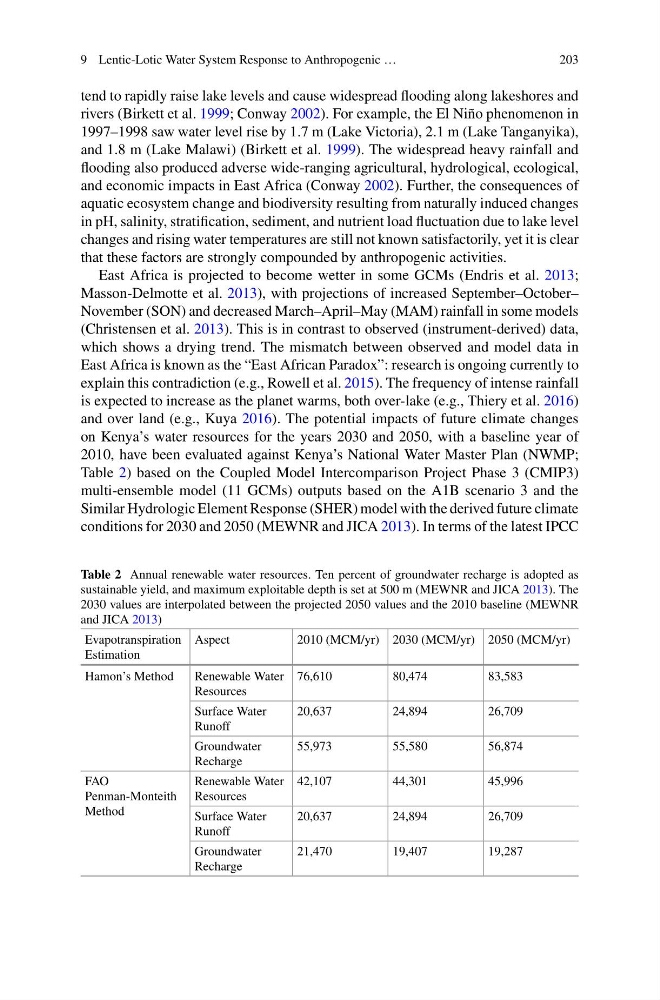
Table 2) based on the Coupled Model Intercomparison Project Phase 3 (CMIP3)
multi-ensemble model (11 GCMs) outputs based on the A1B scenario 3 and the
Similar Hydrologic Element Response (SHER) model with the derived future climate
conditions for 2030 and 2050 (MEWNR and JICA 2013). In terms of the latest IPCC
Table 2 Annual renewable water resources. Ten percent of groundwater recharge is adopted as
sustainable yield, and maximum exploitable depth is set at 500 m (MEWNR and JICA 2013). The
2030 values are interpolated between the projected 2050 values and the 2010 baseline (MEWNR
and JICA 2013)
Evapotranspiration
Estimation
Aspect
2010 (MCM/yr) 2030 (MCM/yr) 2050 (MCM/yr)
Hamon’s Method
Renewable Water
Resources
76,610
80,474
83,583
Surface Water
Runoff
20,637
24,894
26,709
Groundwater
Recharge
55,973
55,580
56,874
FAO
Penman-Monteith
Method
Renewable Water
Resources
42,107
44,301
45,996
Surface Water
Runoff
20,637
24,894
26,709
Groundwater
Recharge
21,470
19,407
19,287
203
tend to rapidly raise lake levels and cause widespread flooding along lakeshores and
rivers (Birkett et al. 1999; Conway 2002). For example, the El Niño phenomenon in
1997–1998 saw water level rise by 1.7 m (Lake Victoria), 2.1 m (Lake Tanganyika),
and 1.8 m (Lake Malawi) (Birkett et al. 1999). The widespread heavy rainfall and
flooding also produced adverse wide-ranging agricultural, hydrological, ecological,
and economic impacts in East Africa (Conway 2002). Further, the consequences of
aquatic ecosystem change and biodiversity resulting from naturally induced changes
in pH, salinity, stratification, sediment, and nutrient load fluctuation due to lake level
changes and rising water temperatures are still not known satisfactorily, yet it is clear
that these factors are strongly compounded by anthropogenic activities.
East Africa is projected to become wetter in some GCMs (Endris et al. 2013;
Masson-Delmotte et al. 2013), with projections of increased September–October–
November (SON) and decreased March–April–May (MAM) rainfall in some models
(Christensen et al. 2013). This is in contrast to observed (instrument-derived) data,
which shows a drying trend. The mismatch between observed and model data in
East Africa is known as the “East African Paradox”: research is ongoing currently to
explain this contradiction (e.g., Rowell et al. 2015). The frequency of intense rainfall
is expected to increase as the planet warms, both over-lake (e.g., Thiery et al. 2016)
and over land (e.g., Kuya 2016). The potential impacts of future climate changes
on Kenya’s water resources for the years 2030 and 2050, with a baseline year of
2010, have been evaluated against Kenya’s National Water Master Plan (NWMP;
Table 2) based on the Coupled Model Intercomparison Project Phase 3 (CMIP3)
multi-ensemble model (11 GCMs) outputs based on the A1B scenario 3 and the
Similar Hydrologic Element Response (SHER) model with the derived future climate
conditions for 2030 and 2050 (MEWNR and JICA 2013). In terms of the latest IPCC
Table 2 Annual renewable water resources. Ten percent of groundwater recharge is adopted as
sustainable yield, and maximum exploitable depth is set at 500 m (MEWNR and JICA 2013). The
2030 values are interpolated between the projected 2050 values and the 2010 baseline (MEWNR
and JICA 2013)
Evapotranspiration
Estimation
Aspect
2010 (MCM/yr) 2030 (MCM/yr) 2050 (MCM/yr)
Hamon’s Method
Renewable Water
Resources
76,610
80,474
83,583
Surface Water
Runoff
20,637
24,894
26,709
Groundwater
Recharge
55,973
55,580
56,874
FAO
Penman-Monteith
Method
Renewable Water
Resources
42,107
44,301
45,996
Surface Water
Runoff
20,637
24,894
26,709
Groundwater
Recharge
21,470
19,407
19,287