

120
S. Kusangaya et al.
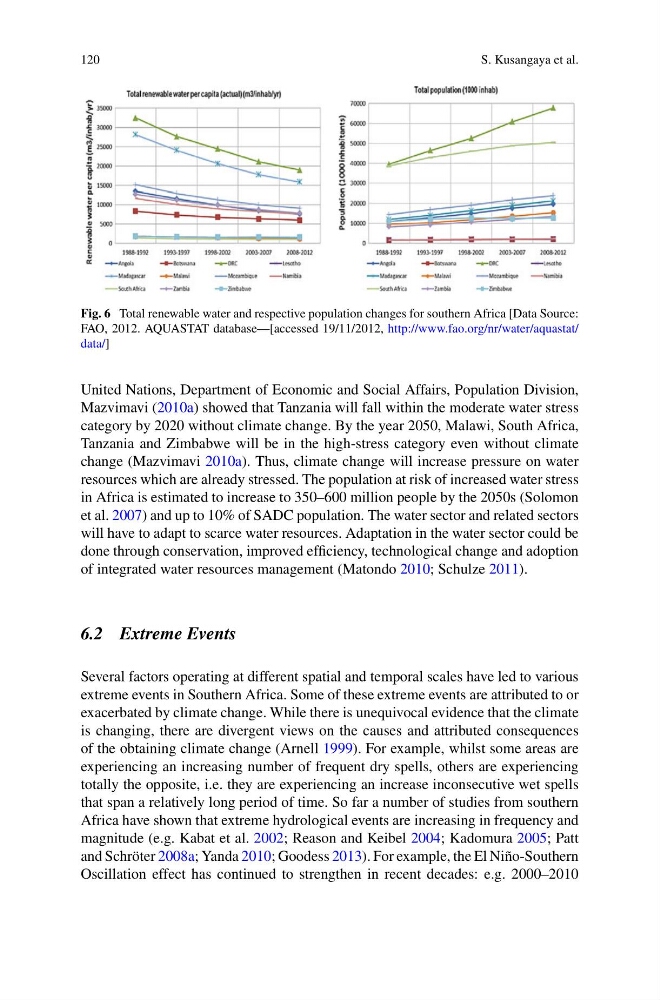
Fig. 6 Total renewable water and respective population changes for southern Africa [Data Source:
FAO, 2012. AQUASTAT database—[accessed 19/11/2012, http://www.fao.org/nr/water/aquastat/
data/]
United Nations, Department of Economic and Social Affairs, Population Division,
Mazvimavi (2010a) showed that Tanzania will fall within the moderate water stress
category by 2020 without climate change. By the year 2050, Malawi, South Africa,
Tanzania and Zimbabwe will be in the high-stress category even without climate
change (Mazvimavi 2010a). Thus, climate change will increase pressure on water
resources which are already stressed. The population at risk of increased water stress
in Africa is estimated to increase to 350–600 million people by the 2050s (Solomon
et al. 2007) and up to 10% of SADC population. The water sector and related sectors
will have to adapt to scarce water resources. Adaptation in the water sector could be
done through conservation, improved efficiency, technological change and adoption
of integrated water resources management (Matondo 2010; Schulze 2011).
6.2 Extreme Events
Several factors operating at different spatial and temporal scales have led to various
extreme events in Southern Africa. Some of these extreme events are attributed to or
exacerbated by climate change. While there is unequivocal evidence that the climate
is changing, there are divergent views on the causes and attributed consequences
of the obtaining climate change (Arnell 1999). For example, whilst some areas are
experiencing an increasing number of frequent dry spells, others are experiencing
totally the opposite, i.e. they are experiencing an increase inconsecutive wet spells
that span a relatively long period of time. So far a number of studies from southern
Africa have shown that extreme hydrological events are increasing in frequency and
magnitude (e.g. Kabat et al. 2002; Reason and Keibel 2004; Kadomura 2005; Patt
and Schröter 2008a; Yanda 2010; Goodess 2013). For example, the El Niño-Southern
Oscillation effect has continued to strengthen in recent decades: e.g. 2000–2010
S. Kusangaya et al.
Fig. 6 Total renewable water and respective population changes for southern Africa [Data Source:
FAO, 2012. AQUASTAT database—[accessed 19/11/2012, http://www.fao.org/nr/water/aquastat/
data/]
United Nations, Department of Economic and Social Affairs, Population Division,
Mazvimavi (2010a) showed that Tanzania will fall within the moderate water stress
category by 2020 without climate change. By the year 2050, Malawi, South Africa,
Tanzania and Zimbabwe will be in the high-stress category even without climate
change (Mazvimavi 2010a). Thus, climate change will increase pressure on water
resources which are already stressed. The population at risk of increased water stress
in Africa is estimated to increase to 350–600 million people by the 2050s (Solomon
et al. 2007) and up to 10% of SADC population. The water sector and related sectors
will have to adapt to scarce water resources. Adaptation in the water sector could be
done through conservation, improved efficiency, technological change and adoption
of integrated water resources management (Matondo 2010; Schulze 2011).
6.2 Extreme Events
Several factors operating at different spatial and temporal scales have led to various
extreme events in Southern Africa. Some of these extreme events are attributed to or
exacerbated by climate change. While there is unequivocal evidence that the climate
is changing, there are divergent views on the causes and attributed consequences
of the obtaining climate change (Arnell 1999). For example, whilst some areas are
experiencing an increasing number of frequent dry spells, others are experiencing
totally the opposite, i.e. they are experiencing an increase inconsecutive wet spells
that span a relatively long period of time. So far a number of studies from southern
Africa have shown that extreme hydrological events are increasing in frequency and
magnitude (e.g. Kabat et al. 2002; Reason and Keibel 2004; Kadomura 2005; Patt
and Schröter 2008a; Yanda 2010; Goodess 2013). For example, the El Niño-Southern
Oscillation effect has continued to strengthen in recent decades: e.g. 2000–2010