

5 Climate Change Impact on Hydrological Regimes …
103
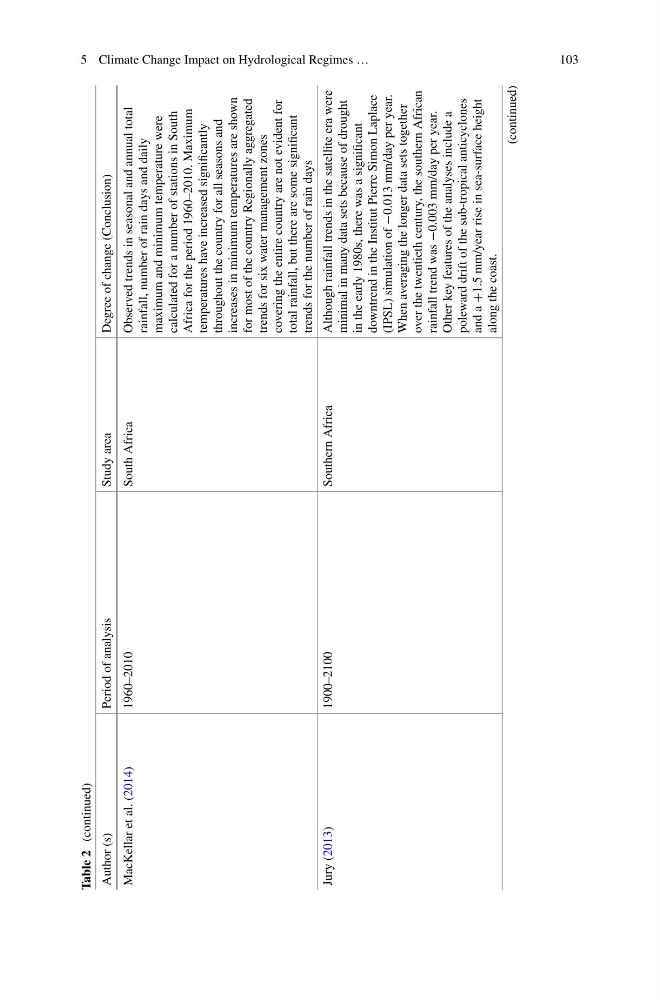
Table 2
(continued)
Author (s)
Period of analysis
Study area
Degree of change (Conclusion)
MacKellar et al. (2014)
1960–2010
South Africa
Observed trends in seasonal and annual total
rainfall, number of rain days and daily
maximum and minimum temperature were
calculated for a number of stations in South
Africa for the period 1960–2010. Maximum
temperatures have increased significantly
throughout the country for all seasons and
increases in minimum temperatures are shown
for most of the country Regionally aggregated
trends for six water management zones
covering the entire country are not evident for
total rainfall, but there are some significant
trends for the number of rain days
Jury (2013)
1900–2100
Southern Africa
Although rainfall trends in the satellite era were
minimal in many data sets because of drought
in the early 1980s, there was a significant
downtrend in the Institut Pierre Simon Laplace
(IPSL) simulation of
−0.013 mm/day per year.
When averaging the longer data sets together
over the twentieth century, the southern African
rainfall trend was
−0.003 mm/day per year.
Other key features of the analyses include a
poleward drift of the sub-tropical anticyclones
and a
+1.5 mm/year rise in sea-surface height
along the coast.
(continued)
103
Table 2
(continued)
Author (s)
Period of analysis
Study area
Degree of change (Conclusion)
MacKellar et al. (2014)
1960–2010
South Africa
Observed trends in seasonal and annual total
rainfall, number of rain days and daily
maximum and minimum temperature were
calculated for a number of stations in South
Africa for the period 1960–2010. Maximum
temperatures have increased significantly
throughout the country for all seasons and
increases in minimum temperatures are shown
for most of the country Regionally aggregated
trends for six water management zones
covering the entire country are not evident for
total rainfall, but there are some significant
trends for the number of rain days
Jury (2013)
1900–2100
Southern Africa
Although rainfall trends in the satellite era were
minimal in many data sets because of drought
in the early 1980s, there was a significant
downtrend in the Institut Pierre Simon Laplace
(IPSL) simulation of
−0.013 mm/day per year.
When averaging the longer data sets together
over the twentieth century, the southern African
rainfall trend was
−0.003 mm/day per year.
Other key features of the analyses include a
poleward drift of the sub-tropical anticyclones
and a
+1.5 mm/year rise in sea-surface height
along the coast.
(continued)