

88
N. Sharma and R. Choudhary
Table 6.4 Response table for
Nusselt number
Levels
A
B
C
1
32.05
35.51
37.12
2
35.93
36.22
36.33
3
38.1
36.83
36.14
4
39.67
37.18
36.15
Delta
7.62
1.67
0.98
Rank
1
2
3
Contribution ratio (%)
74.20
16.26
9.54
Table 6.5 Response table for
friction factor
Levels
A
B
C
1
37.15
40.51
38.85
2
38.82
39.47
38.85
3
39.32
38.22
38.83
4
40.06
37.14
38.81
Delta
2.91
3.37
0.03
Rank
2
1
3
Contribution ratio (%)
46.12
53.41
0.47
Table 6.6 Response table for
thermohydraulic performance
Levels
A
B
C
1
7.241
5.731
6.79
2
6.362
6.094
5.993
3
5.591
6.281
5.8
4
5.194
6.282
5.805
Delta
2.047
0.55
0.991
Rank
1
3
2
Contribution ratio (%)
57.05
15.33
27.62
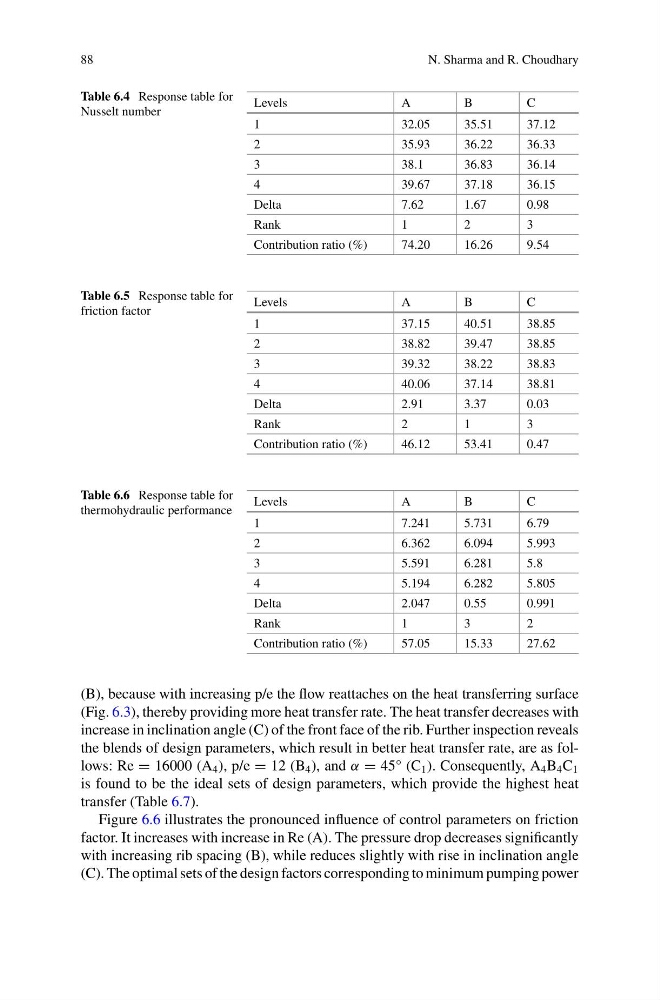
(B), because with increasing p/e the flow reattaches on the heat transferring surface
(Fig. 6.3), thereby providing more heat transfer rate. The heat transfer decreases with
increase in inclination angle (C) of the front face of the rib. Further inspection reveals
the blends of design parameters, which result in better heat transfer rate, are as follows: Re = 16000 (A 4 ), p/e = 12 (B 4 ), and α = 45° (C 1 ). Consequently, A 4 B 4 C 1
is found to be the ideal sets of design parameters, which provide the highest heat
transfer (Table 6.7).
Figure 6.6 illustrates the pronounced influence of control parameters on friction
factor. It increases with increase in Re (A). The pressure drop decreases significantly
with increasing rib spacing (B), while reduces slightly with rise in inclination angle
(C). The optimal sets of the design factors corresponding to minimum pumping power
N. Sharma and R. Choudhary
Table 6.4 Response table for
Nusselt number
Levels
A
B
C
1
32.05
35.51
37.12
2
35.93
36.22
36.33
3
38.1
36.83
36.14
4
39.67
37.18
36.15
Delta
7.62
1.67
0.98
Rank
1
2
3
Contribution ratio (%)
74.20
16.26
9.54
Table 6.5 Response table for
friction factor
Levels
A
B
C
1
37.15
40.51
38.85
2
38.82
39.47
38.85
3
39.32
38.22
38.83
4
40.06
37.14
38.81
Delta
2.91
3.37
0.03
Rank
2
1
3
Contribution ratio (%)
46.12
53.41
0.47
Table 6.6 Response table for
thermohydraulic performance
Levels
A
B
C
1
7.241
5.731
6.79
2
6.362
6.094
5.993
3
5.591
6.281
5.8
4
5.194
6.282
5.805
Delta
2.047
0.55
0.991
Rank
1
3
2
Contribution ratio (%)
57.05
15.33
27.62
(B), because with increasing p/e the flow reattaches on the heat transferring surface
(Fig. 6.3), thereby providing more heat transfer rate. The heat transfer decreases with
increase in inclination angle (C) of the front face of the rib. Further inspection reveals
the blends of design parameters, which result in better heat transfer rate, are as follows: Re = 16000 (A 4 ), p/e = 12 (B 4 ), and α = 45° (C 1 ). Consequently, A 4 B 4 C 1
is found to be the ideal sets of design parameters, which provide the highest heat
transfer (Table 6.7).
Figure 6.6 illustrates the pronounced influence of control parameters on friction
factor. It increases with increase in Re (A). The pressure drop decreases significantly
with increasing rib spacing (B), while reduces slightly with rise in inclination angle
(C). The optimal sets of the design factors corresponding to minimum pumping power