

11 PCM-Metal Foam Composite Systems for Solar Energy Storage
227
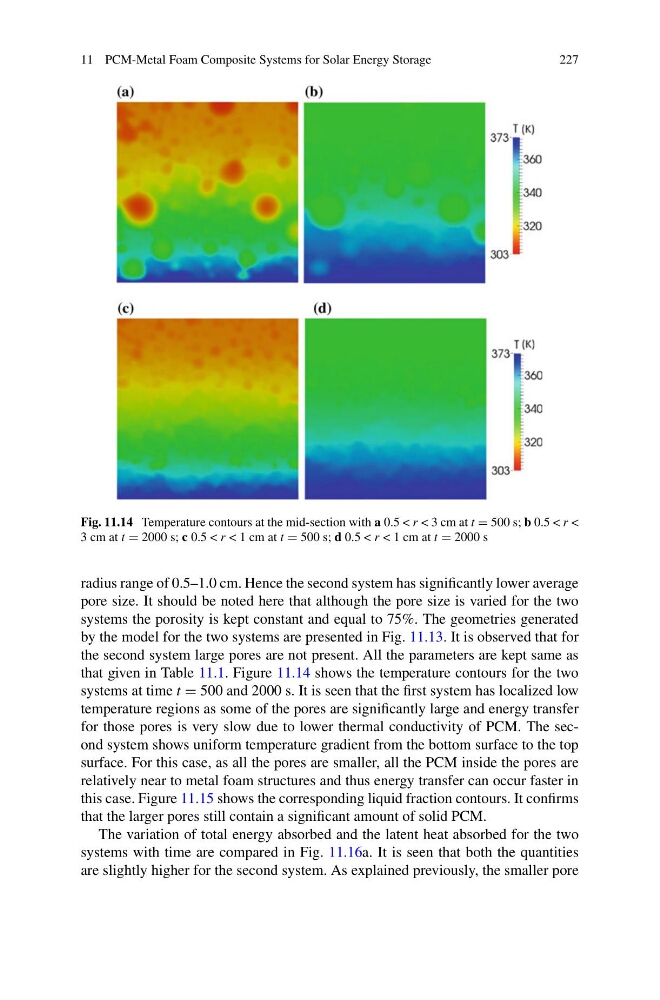
Fig. 11.14 Temperature contours at the mid-section with a 0.5 < r < 3 cm at t = 500 s; b 0.5 < r <
3 cm at t = 2000 s; c 0.5 < r < 1 cm at t = 500 s; d 0.5 < r < 1 cm at t = 2000 s
radius range of 0.5–1.0 cm. Hence the second system has significantly lower average
pore size. It should be noted here that although the pore size is varied for the two
systems the porosity is kept constant and equal to 75%. The geometries generated
by the model for the two systems are presented in Fig. 11.13. It is observed that for
the second system large pores are not present. All the parameters are kept same as
that given in Table 11.1. Figure 11.14 shows the temperature contours for the two
systems at time t = 500 and 2000 s. It is seen that the first system has localized low
temperature regions as some of the pores are significantly large and energy transfer
for those pores is very slow due to lower thermal conductivity of PCM. The second system shows uniform temperature gradient from the bottom surface to the top
surface. For this case, as all the pores are smaller, all the PCM inside the pores are
relatively near to metal foam structures and thus energy transfer can occur faster in
this case. Figure 11.15 shows the corresponding liquid fraction contours. It confirms
that the larger pores still contain a significant amount of solid PCM.
The variation of total energy absorbed and the latent heat absorbed for the two
systems with time are compared in Fig. 11.16a. It is seen that both the quantities
are slightly higher for the second system. As explained previously, the smaller pore
227
Fig. 11.14 Temperature contours at the mid-section with a 0.5 < r < 3 cm at t = 500 s; b 0.5 < r <
3 cm at t = 2000 s; c 0.5 < r < 1 cm at t = 500 s; d 0.5 < r < 1 cm at t = 2000 s
radius range of 0.5–1.0 cm. Hence the second system has significantly lower average
pore size. It should be noted here that although the pore size is varied for the two
systems the porosity is kept constant and equal to 75%. The geometries generated
by the model for the two systems are presented in Fig. 11.13. It is observed that for
the second system large pores are not present. All the parameters are kept same as
that given in Table 11.1. Figure 11.14 shows the temperature contours for the two
systems at time t = 500 and 2000 s. It is seen that the first system has localized low
temperature regions as some of the pores are significantly large and energy transfer
for those pores is very slow due to lower thermal conductivity of PCM. The second system shows uniform temperature gradient from the bottom surface to the top
surface. For this case, as all the pores are smaller, all the PCM inside the pores are
relatively near to metal foam structures and thus energy transfer can occur faster in
this case. Figure 11.15 shows the corresponding liquid fraction contours. It confirms
that the larger pores still contain a significant amount of solid PCM.
The variation of total energy absorbed and the latent heat absorbed for the two
systems with time are compared in Fig. 11.16a. It is seen that both the quantities
are slightly higher for the second system. As explained previously, the smaller pore