

202
S. Sangwan and P. R. Chakraborty
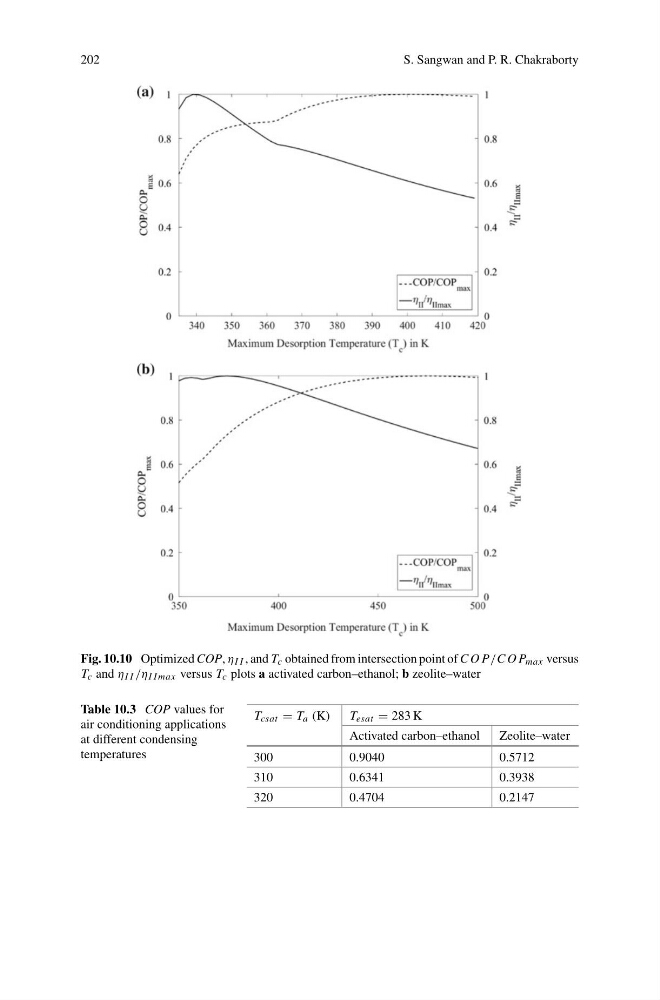
Fig. 10.10 Optimized COP, η I I , and T c obtained from intersection point of C O P/C O P max versus
T c and η I I /η I Imax versus T c plots a activated carbon–ethanol; b zeolite–water
Table 10.3 COP values for
air conditioning applications
at different condensing
temperatures
T csat = T a (K)
T esat = 283 K
Activated carbon–ethanol
Zeolite–water
300
0.9040
0.5712
310
0.6341
0.3938
320
0.4704
0.2147
S. Sangwan and P. R. Chakraborty
Fig. 10.10 Optimized COP, η I I , and T c obtained from intersection point of C O P/C O P max versus
T c and η I I /η I Imax versus T c plots a activated carbon–ethanol; b zeolite–water
Table 10.3 COP values for
air conditioning applications
at different condensing
temperatures
T csat = T a (K)
T esat = 283 K
Activated carbon–ethanol
Zeolite–water
300
0.9040
0.5712
310
0.6341
0.3938
320
0.4704
0.2147