

7 Mathematical Modelling of Solar Updraft Tower
111
Additionally, it is observed that the velocity of air reaches a maximum at the top
of the chimney. But it is infeasible to install a turbine at such a large height.
7.3.6 Comparison of Power Output Between 21st June
and 21st December
In order to get an idea about the average performance of the plant, a comparison
between 21st June and 21st December is necessary because, these are the days with
the maximum and minimum incident solar radiation respectively. By doing an analysis on 21st December similar to the earlier one, the range of power outputs that can
be obtained using the plant is calculated. It is found that the power output between
11:00 and 12:00 ranges from 118.81 to 145.43 kW in case 1 and from 91.41 to
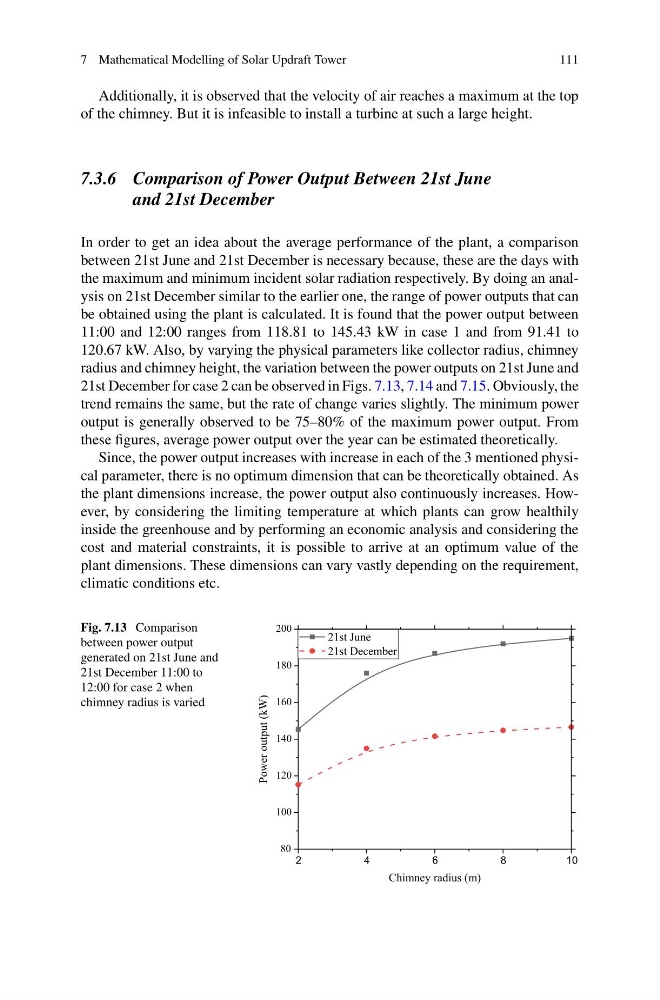
120.67 kW. Also, by varying the physical parameters like collector radius, chimney
radius and chimney height, the variation between the power outputs on 21st June and
21st December for case 2 can be observed in Figs. 7.13, 7.14 and 7.15. Obviously, the
trend remains the same, but the rate of change varies slightly. The minimum power
output is generally observed to be 75–80% of the maximum power output. From
these figures, average power output over the year can be estimated theoretically.
Since, the power output increases with increase in each of the 3 mentioned physical parameter, there is no optimum dimension that can be theoretically obtained. As
the plant dimensions increase, the power output also continuously increases. However, by considering the limiting temperature at which plants can grow healthily
inside the greenhouse and by performing an economic analysis and considering the
cost and material constraints, it is possible to arrive at an optimum value of the
plant dimensions. These dimensions can vary vastly depending on the requirement,
climatic conditions etc.
Fig. 7.13 Comparison
between power output
generated on 21st June and
21st December 11:00 to
12:00 for case 2 when
chimney radius is varied
2
4
6
8
1 0
80
100
120
140
160
180
200
Power output (kW)
Chimney radius (m)
21st June
21st December
111
Additionally, it is observed that the velocity of air reaches a maximum at the top
of the chimney. But it is infeasible to install a turbine at such a large height.
7.3.6 Comparison of Power Output Between 21st June
and 21st December
In order to get an idea about the average performance of the plant, a comparison
between 21st June and 21st December is necessary because, these are the days with
the maximum and minimum incident solar radiation respectively. By doing an analysis on 21st December similar to the earlier one, the range of power outputs that can
be obtained using the plant is calculated. It is found that the power output between
11:00 and 12:00 ranges from 118.81 to 145.43 kW in case 1 and from 91.41 to
120.67 kW. Also, by varying the physical parameters like collector radius, chimney
radius and chimney height, the variation between the power outputs on 21st June and
21st December for case 2 can be observed in Figs. 7.13, 7.14 and 7.15. Obviously, the
trend remains the same, but the rate of change varies slightly. The minimum power
output is generally observed to be 75–80% of the maximum power output. From
these figures, average power output over the year can be estimated theoretically.
Since, the power output increases with increase in each of the 3 mentioned physical parameter, there is no optimum dimension that can be theoretically obtained. As
the plant dimensions increase, the power output also continuously increases. However, by considering the limiting temperature at which plants can grow healthily
inside the greenhouse and by performing an economic analysis and considering the
cost and material constraints, it is possible to arrive at an optimum value of the
plant dimensions. These dimensions can vary vastly depending on the requirement,
climatic conditions etc.
Fig. 7.13 Comparison
between power output
generated on 21st June and
21st December 11:00 to
12:00 for case 2 when
chimney radius is varied
2
4
6
8
1 0
80
100
120
140
160
180
200
Power output (kW)
Chimney radius (m)
21st June
21st December