

7 Mathematical Modelling of Solar Updraft Tower
105
6:00
9:00
12:00
15:00
18:00
30
40
50
60
70
80
Temperature (
o
C)
Time of the day (hr)
Ambient temperature
Temperature at turbine inlet (without losses)
Temperature at turbine inlet (with losses)
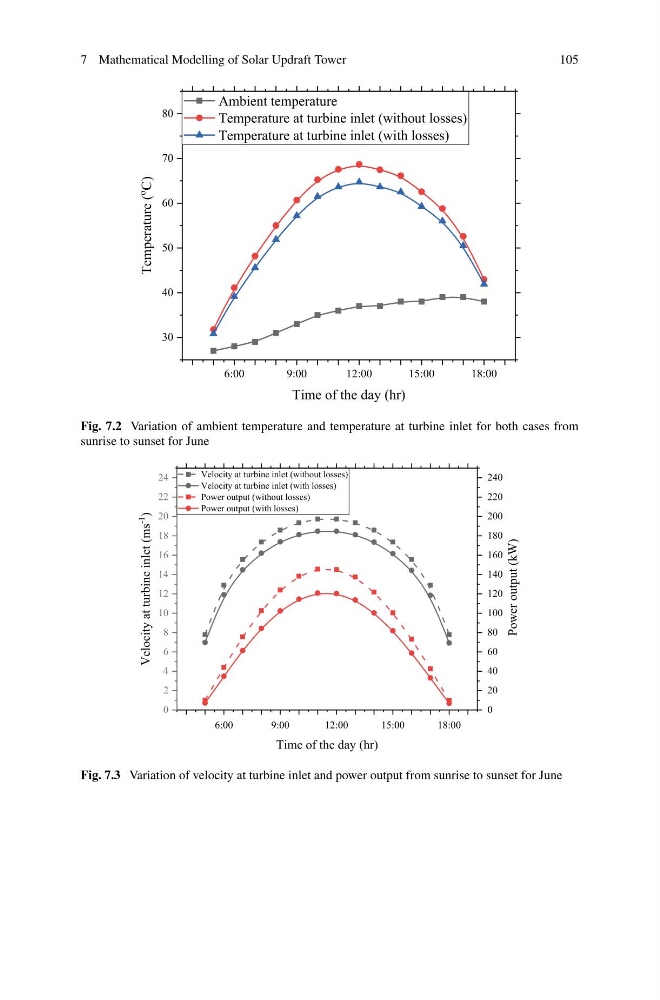
Fig. 7.2 Variation of ambient temperature and temperature at turbine inlet for both cases from
sunrise to sunset for June
6:00
9:00
12:00
15:00
18:00
0
2
4
6
8
10
12
14
16
18
20
22
24
Velocity at turbine inlet (without losses)
Velocity at turbine inlet (with losses)
Power output (without losses)
Power output (with losses)
Time of the day (hr)
Velocity at turbine inlet (ms
-1
)
0
20
40
60
80
100
120
140
160
180
200
220
240
Power output (kW)
Fig. 7.3 Variation of velocity at turbine inlet and power output from sunrise to sunset for June
105
6:00
9:00
12:00
15:00
18:00
30
40
50
60
70
80
Temperature (
o
C)
Time of the day (hr)
Ambient temperature
Temperature at turbine inlet (without losses)
Temperature at turbine inlet (with losses)
Fig. 7.2 Variation of ambient temperature and temperature at turbine inlet for both cases from
sunrise to sunset for June
6:00
9:00
12:00
15:00
18:00
0
2
4
6
8
10
12
14
16
18
20
22
24
Velocity at turbine inlet (without losses)
Velocity at turbine inlet (with losses)
Power output (without losses)
Power output (with losses)
Time of the day (hr)
Velocity at turbine inlet (ms
-1
)
0
20
40
60
80
100
120
140
160
180
200
220
240
Power output (kW)
Fig. 7.3 Variation of velocity at turbine inlet and power output from sunrise to sunset for June