

which is obvious due to their higher economic growth and hence better spending
power. Nevertheless, each state has accorded a low priority to agriculture and
irrigation in their public expenditure policy. Not only the share of public expenditure in this sector in total expenditure has declined from 13 to 5.4%, its share with
respect to national income has also remained constant. The Agriculture Orientation
Index of public spending verifies it—0.58 in TE 1983–84, declined to 0.49 in TE
2003–04 and then back to the same level by 2015–16. The AOI showed a slight
upturn from mid-2000s in Andhra Pradesh, Bihar, Chhattisgarh, J&K, Karnataka,
Kerala, Odisha, and Uttarakhand but weakens in Gujarat, Jharkhand, Madhya
Pradesh, Maharashtra, Punjab, Rajasthan, Tamil Nadu, Uttar Pradesh, and West
0.000
0.200
0.400
0.600
0.800
1.000
1.200
Himachal…
Jharkhand
Uttar Pradesh
Gujarat
Kerala
Andhra Pradesh
Tamil Nadu
Assam
Rajasthan
Uttarakhand
Punjab
Bihar
Maharashtra
Haryana
Karnataka
Odisha
Jammu &…
West Bengal
Madhya Pradesh
Chhattisgarh
1982-86
1992-96
2002-06
2012-16
0.000
0.200
0.400
0.600
0.800
1.000
1.200
Himachal Pradesh
Jharkhand
Uttar Pradesh
Gujarat
Kerala
Andhra Pradesh
Tamil Nadu
Assam
Rajasthan
Uttarakhand
Punjab
Bihar
Maharashtra
Haryana
Karnataka
Odisha
Jammu & Kashmir
West Bengal
Madhya Pradesh
Chhattisgarh
1982-86
2012-16
a
b
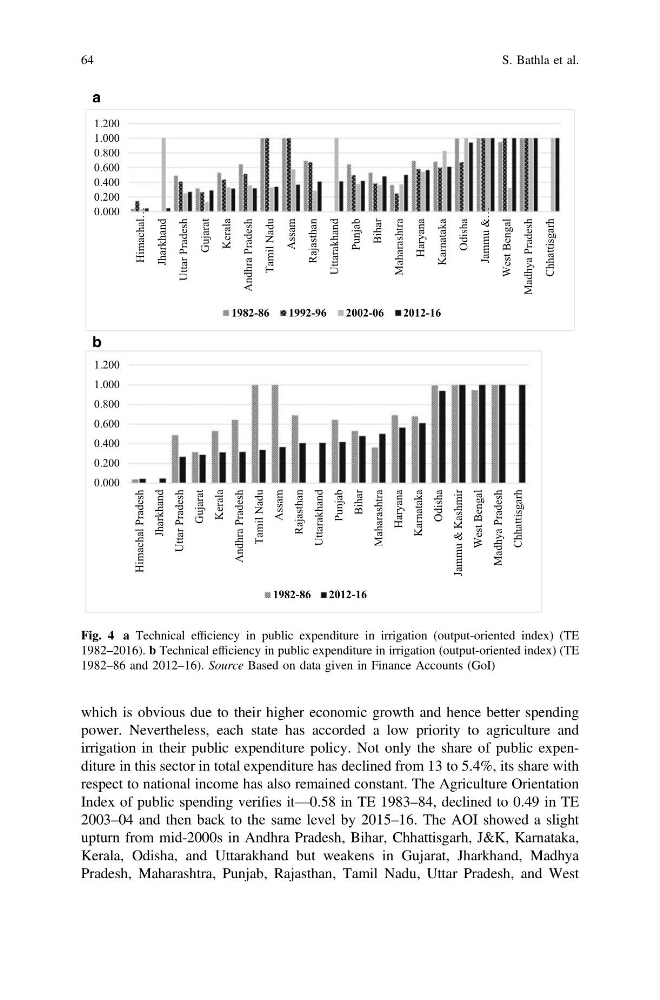
Fig. 4 a Technical efficiency in public expenditure in irrigation (output-oriented index) (TE
1982–2016). b Technical efficiency in public expenditure in irrigation (output-oriented index) (TE
1982–86 and 2012–16). Source Based on data given in Finance Accounts (GoI)
64
S. Bathla et al.
power. Nevertheless, each state has accorded a low priority to agriculture and
irrigation in their public expenditure policy. Not only the share of public expenditure in this sector in total expenditure has declined from 13 to 5.4%, its share with
respect to national income has also remained constant. The Agriculture Orientation
Index of public spending verifies it—0.58 in TE 1983–84, declined to 0.49 in TE
2003–04 and then back to the same level by 2015–16. The AOI showed a slight
upturn from mid-2000s in Andhra Pradesh, Bihar, Chhattisgarh, J&K, Karnataka,
Kerala, Odisha, and Uttarakhand but weakens in Gujarat, Jharkhand, Madhya
Pradesh, Maharashtra, Punjab, Rajasthan, Tamil Nadu, Uttar Pradesh, and West
0.000
0.200
0.400
0.600
0.800
1.000
1.200
Himachal…
Jharkhand
Uttar Pradesh
Gujarat
Kerala
Andhra Pradesh
Tamil Nadu
Assam
Rajasthan
Uttarakhand
Punjab
Bihar
Maharashtra
Haryana
Karnataka
Odisha
Jammu &…
West Bengal
Madhya Pradesh
Chhattisgarh
1982-86
1992-96
2002-06
2012-16
0.000
0.200
0.400
0.600
0.800
1.000
1.200
Himachal Pradesh
Jharkhand
Uttar Pradesh
Gujarat
Kerala
Andhra Pradesh
Tamil Nadu
Assam
Rajasthan
Uttarakhand
Punjab
Bihar
Maharashtra
Haryana
Karnataka
Odisha
Jammu & Kashmir
West Bengal
Madhya Pradesh
Chhattisgarh
1982-86
2012-16
a
b
Fig. 4 a Technical efficiency in public expenditure in irrigation (output-oriented index) (TE
1982–2016). b Technical efficiency in public expenditure in irrigation (output-oriented index) (TE
1982–86 and 2012–16). Source Based on data given in Finance Accounts (GoI)
64
S. Bathla et al.