

trace and repair. However, when the structure starts being used, the welds are
submitted to loadings, which may fluctuate both in magnitude and direction. At
any crack in the welds, the operative cross sectional area is smaller, thereby creating
higher stresses (stress ¼ force/area). If the stress is very high, such as at the tip of the
crack (refer to Fig. 20.4), the material can become plastic. The most stressed portion
of the weld will yield, causing the crack to propagate further. This increases the
stress slightly further than this point, thereby entailing the crack to propagate
continuously. Gradually, the crack can propagate to such a magnitude that the entire
weld is unable to perform satisfactorily its function.
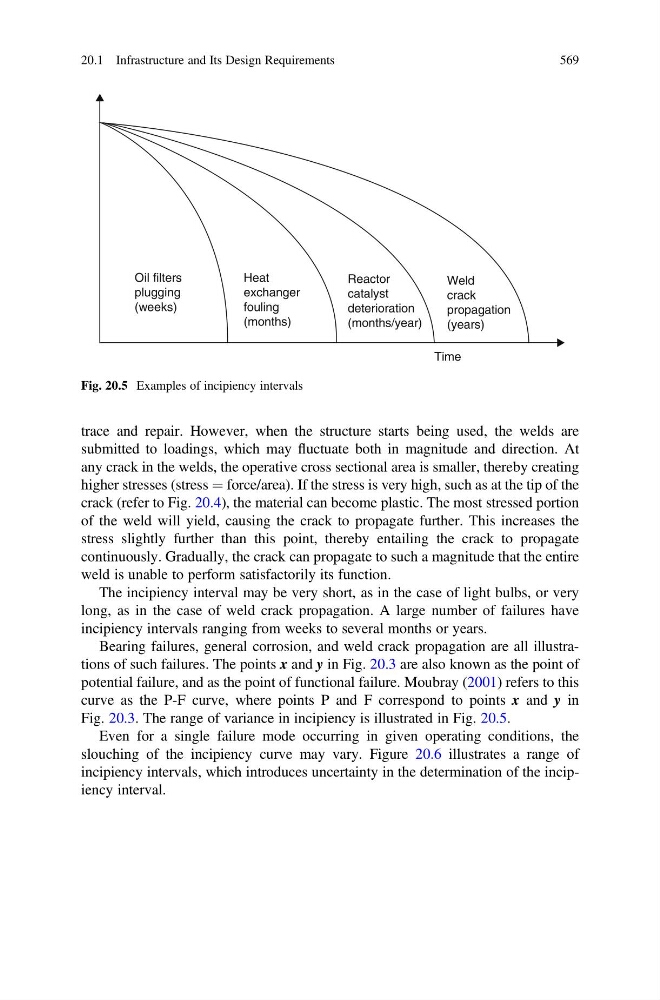
The incipiency interval may be very short, as in the case of light bulbs, or very
long, as in the case of weld crack propagation. A large number of failures have
incipiency intervals ranging from weeks to several months or years.
Bearing failures, general corrosion, and weld crack propagation are all illustrations of such failures. The points x and y in Fig. 20.3 are also known as the point of
potential failure, and as the point of functional failure. Moubray (2001) refers to this
curve as the P-F curve, where points P and F correspond to points x and y in
Fig. 20.3. The range of variance in incipiency is illustrated in Fig. 20.5.
Even for a single failure mode occurring in given operating conditions, the
slouching of the incipiency curve may vary. Figure 20.6 illustrates a range of
incipiency intervals, which introduces uncertainty in the determination of the incipiency interval.
Weld
crack
propagation
(years)
Oil filters
plugging
(weeks)
Heat
exchanger
fouling
(months)
Reactor
catalyst
deterioration
(months/year)
Time
Fig. 20.5 Examples of incipiency intervals
20.1 Infrastructure and Its Design Requirements
569