

three criteria to translate the raw scores onto a common 10-point scale. Instead, the
best score is assigned the 10-rating and the worst score assigned the 0-rating. All
other valuations are assigned scores in between these two boundary points by means
of linear interpolation, i.e.:
• For criterion 1 – land costs
• Site No. 1 (cost Rs.0; 10-rating)
• Site No.5 (cost Rs. 17.9 million; 0-rating)
Therefore:
Site Nos 2, 3 and 4 (cost Rs.2 million)
Rating10 Â [(17.9À2.0) Ä 17.9] ¼ 8.9
Site No.6 (cost Rs.0.6 million)
Rating10 Â [(17.9À0.6) Ä 17.9] ¼ 9.7
The same calculations are repeated for the second and third criteria. In the case of
‘building costs’, site No. 5 is assigned the 10-rating and site No. 2 is assigned the
0-rating. For ‘labour costs’, site No. 6 is assigned the 10-rating with the 0-rating
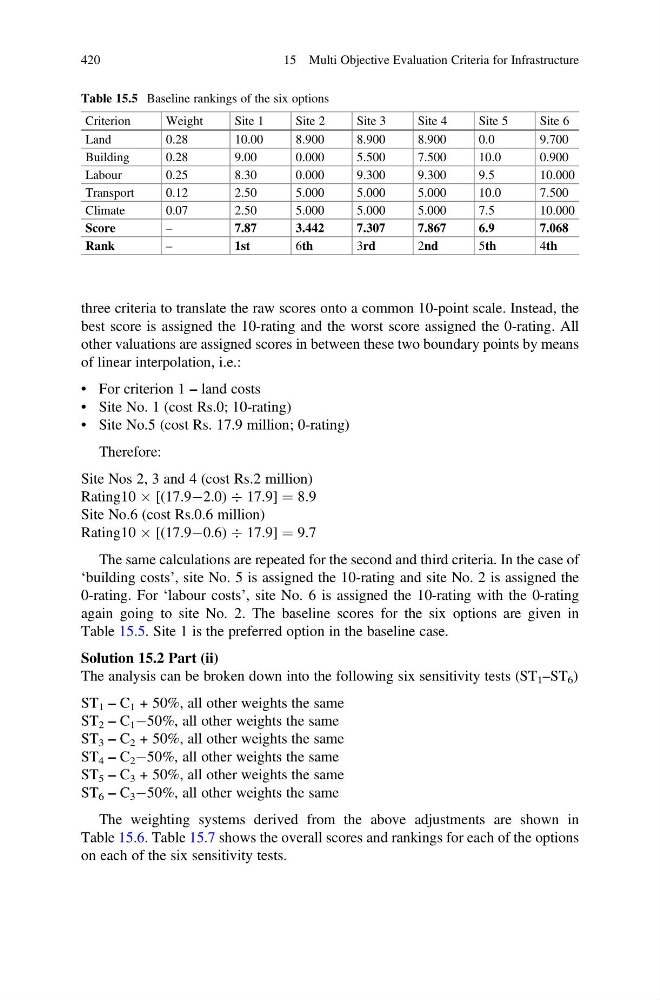
again going to site No. 2. The baseline scores for the six options are given in
Table 15.5. Site 1 is the preferred option in the baseline case.
Solution 15.2 Part (ii)
The analysis can be broken down into the following six sensitivity tests (ST 1 –ST 6 )
ST 1 – C 1 + 50%, all other weights the same
ST 2 – C 1 À50%, all other weights the same
ST 3 – C 2 + 50%, all other weights the same
ST 4 – C 2 À50%, all other weights the same
ST 5 – C 3 + 50%, all other weights the same
ST 6 – C 3 À50%, all other weights the same
The weighting systems derived from the above adjustments are shown in
Table 15.6. Table 15.7 shows the overall scores and rankings for each of the options
on each of the six sensitivity tests.
Table 15.5 Baseline rankings of the six options
Criterion
Weight
Site 1
Site 2
Site 3
Site 4
Site 5
Site 6
Land
0.28
10.00
8.900
8.900
8.900
0.0
9.700
Building
0.28
9.00
0.000
5.500
7.500
10.0
0.900
Labour
0.25
8.30
0.000
9.300
9.300
9.5
10.000
Transport
0.12
2.50
5.000
5.000
5.000
10.0
7.500
Climate
0.07
2.50
5.000
5.000
5.000
7.5
10.000
Score
–
7.87
3.442
7.307
7.867
6.9
7.068
Rank
–
1st
6th
3rd
2nd
5th
4th
420
15 Multi Objective Evaluation Criteria for Infrastructure
best score is assigned the 10-rating and the worst score assigned the 0-rating. All
other valuations are assigned scores in between these two boundary points by means
of linear interpolation, i.e.:
• For criterion 1 – land costs
• Site No. 1 (cost Rs.0; 10-rating)
• Site No.5 (cost Rs. 17.9 million; 0-rating)
Therefore:
Site Nos 2, 3 and 4 (cost Rs.2 million)
Rating10 Â [(17.9À2.0) Ä 17.9] ¼ 8.9
Site No.6 (cost Rs.0.6 million)
Rating10 Â [(17.9À0.6) Ä 17.9] ¼ 9.7
The same calculations are repeated for the second and third criteria. In the case of
‘building costs’, site No. 5 is assigned the 10-rating and site No. 2 is assigned the
0-rating. For ‘labour costs’, site No. 6 is assigned the 10-rating with the 0-rating
again going to site No. 2. The baseline scores for the six options are given in
Table 15.5. Site 1 is the preferred option in the baseline case.
Solution 15.2 Part (ii)
The analysis can be broken down into the following six sensitivity tests (ST 1 –ST 6 )
ST 1 – C 1 + 50%, all other weights the same
ST 2 – C 1 À50%, all other weights the same
ST 3 – C 2 + 50%, all other weights the same
ST 4 – C 2 À50%, all other weights the same
ST 5 – C 3 + 50%, all other weights the same
ST 6 – C 3 À50%, all other weights the same
The weighting systems derived from the above adjustments are shown in
Table 15.6. Table 15.7 shows the overall scores and rankings for each of the options
on each of the six sensitivity tests.
Table 15.5 Baseline rankings of the six options
Criterion
Weight
Site 1
Site 2
Site 3
Site 4
Site 5
Site 6
Land
0.28
10.00
8.900
8.900
8.900
0.0
9.700
Building
0.28
9.00
0.000
5.500
7.500
10.0
0.900
Labour
0.25
8.30
0.000
9.300
9.300
9.5
10.000
Transport
0.12
2.50
5.000
5.000
5.000
10.0
7.500
Climate
0.07
2.50
5.000
5.000
5.000
7.5
10.000
Score
–
7.87
3.442
7.307
7.867
6.9
7.068
Rank
–
1st
6th
3rd
2nd
5th
4th
420
15 Multi Objective Evaluation Criteria for Infrastructure