

and the probability (of no occurrence) during a span of N successive
years = (1ÀP)
N .
Therefore, the risk, R or the probability that the event will occur during a span of
N years is given by,
R ¼ 1 À 1 À P
ð
Þ
N
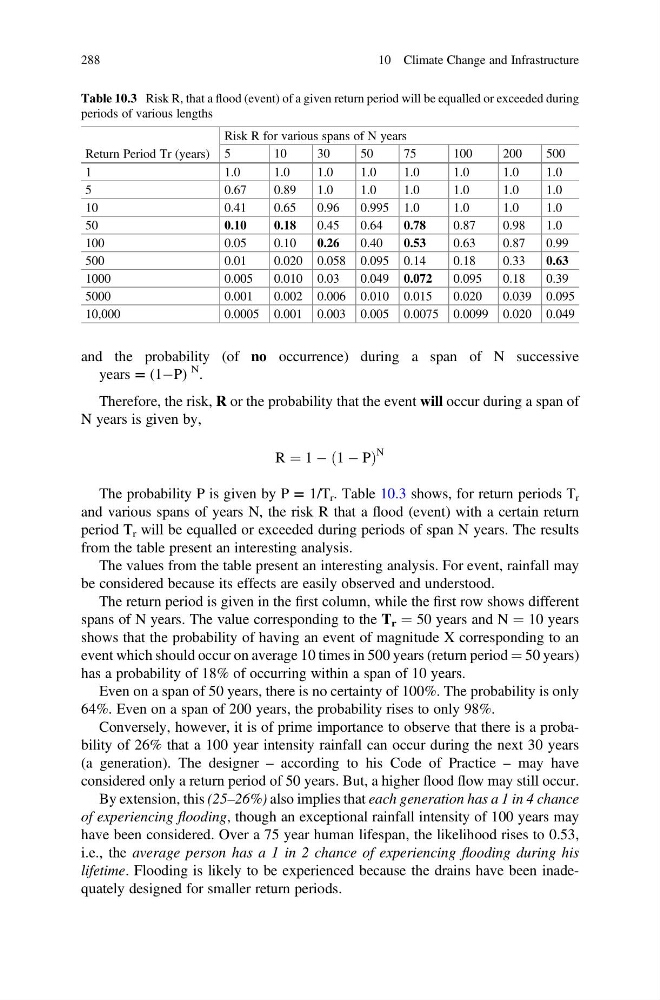
The probability P is given by P = 1/T r . Table 10.3 shows, for return periods T r
and various spans of years N, the risk R that a flood (event) with a certain return
period T r will be equalled or exceeded during periods of span N years. The results
from the table present an interesting analysis.
The values from the table present an interesting analysis. For event, rainfall may
be considered because its effects are easily observed and understood.
The return period is given in the first column, while the first row shows different
spans of N years. The value corresponding to the T r ¼ 50 years and N ¼ 10 years
shows that the probability of having an event of magnitude X corresponding to an
event which should occur on average 10 times in 500 years (return period ¼ 50 years)
has a probability of 18% of occurring within a span of 10 years.
Even on a span of 50 years, there is no certainty of 100%. The probability is only
64%. Even on a span of 200 years, the probability rises to only 98%.
Conversely, however, it is of prime importance to observe that there is a probability of 26% that a 100 year intensity rainfall can occur during the next 30 years
(a generation). The designer – according to his Code of Practice – may have
considered only a return period of 50 years. But, a higher flood flow may still occur.
By extension, this (25–26%) also implies that each generation has a 1 in 4 chance
of experiencing flooding, though an exceptional rainfall intensity of 100 years may
have been considered. Over a 75 year human lifespan, the likelihood rises to 0.53,
i.e., the average person has a 1 in 2 chance of experiencing flooding during his
lifetime. Flooding is likely to be experienced because the drains have been inadequately designed for smaller return periods.
Table 10.3 Risk R, that a flood (event) of a given return period will be equalled or exceeded during
periods of various lengths
Return Period Tr (years)
Risk R for various spans of N years
5
10
30
50
75
100
200
500
1
1.0
1.0
1.0
1.0
1.0
1.0
1.0
1.0
5
0.67
0.89
1.0
1.0
1.0
1.0
1.0
1.0
10
0.41
0.65
0.96
0.995 1.0
1.0
1.0
1.0
50
0.10
0.18
0.45
0.64
0.78
0.87
0.98
1.0
100
0.05
0.10
0.26
0.40
0.53
0.63
0.87
0.99
500
0.01
0.020 0.058 0.095 0.14
0.18
0.33
0.63
1000
0.005
0.010 0.03
0.049 0.072
0.095
0.18
0.39
5000
0.001
0.002 0.006 0.010 0.015
0.020
0.039 0.095
10,000
0.0005 0.001 0.003 0.005 0.0075 0.0099 0.020 0.049
288
10 Climate Change and Infrastructure
years = (1ÀP)
N .
Therefore, the risk, R or the probability that the event will occur during a span of
N years is given by,
R ¼ 1 À 1 À P
ð
Þ
N
The probability P is given by P = 1/T r . Table 10.3 shows, for return periods T r
and various spans of years N, the risk R that a flood (event) with a certain return
period T r will be equalled or exceeded during periods of span N years. The results
from the table present an interesting analysis.
The values from the table present an interesting analysis. For event, rainfall may
be considered because its effects are easily observed and understood.
The return period is given in the first column, while the first row shows different
spans of N years. The value corresponding to the T r ¼ 50 years and N ¼ 10 years
shows that the probability of having an event of magnitude X corresponding to an
event which should occur on average 10 times in 500 years (return period ¼ 50 years)
has a probability of 18% of occurring within a span of 10 years.
Even on a span of 50 years, there is no certainty of 100%. The probability is only
64%. Even on a span of 200 years, the probability rises to only 98%.
Conversely, however, it is of prime importance to observe that there is a probability of 26% that a 100 year intensity rainfall can occur during the next 30 years
(a generation). The designer – according to his Code of Practice – may have
considered only a return period of 50 years. But, a higher flood flow may still occur.
By extension, this (25–26%) also implies that each generation has a 1 in 4 chance
of experiencing flooding, though an exceptional rainfall intensity of 100 years may
have been considered. Over a 75 year human lifespan, the likelihood rises to 0.53,
i.e., the average person has a 1 in 2 chance of experiencing flooding during his
lifetime. Flooding is likely to be experienced because the drains have been inadequately designed for smaller return periods.
Table 10.3 Risk R, that a flood (event) of a given return period will be equalled or exceeded during
periods of various lengths
Return Period Tr (years)
Risk R for various spans of N years
5
10
30
50
75
100
200
500
1
1.0
1.0
1.0
1.0
1.0
1.0
1.0
1.0
5
0.67
0.89
1.0
1.0
1.0
1.0
1.0
1.0
10
0.41
0.65
0.96
0.995 1.0
1.0
1.0
1.0
50
0.10
0.18
0.45
0.64
0.78
0.87
0.98
1.0
100
0.05
0.10
0.26
0.40
0.53
0.63
0.87
0.99
500
0.01
0.020 0.058 0.095 0.14
0.18
0.33
0.63
1000
0.005
0.010 0.03
0.049 0.072
0.095
0.18
0.39
5000
0.001
0.002 0.006 0.010 0.015
0.020
0.039 0.095
10,000
0.0005 0.001 0.003 0.005 0.0075 0.0099 0.020 0.049
288
10 Climate Change and Infrastructure