

waste discharges and the withdrawal of environmental commodities are measured in
physical terms, and the measure used will be weight.
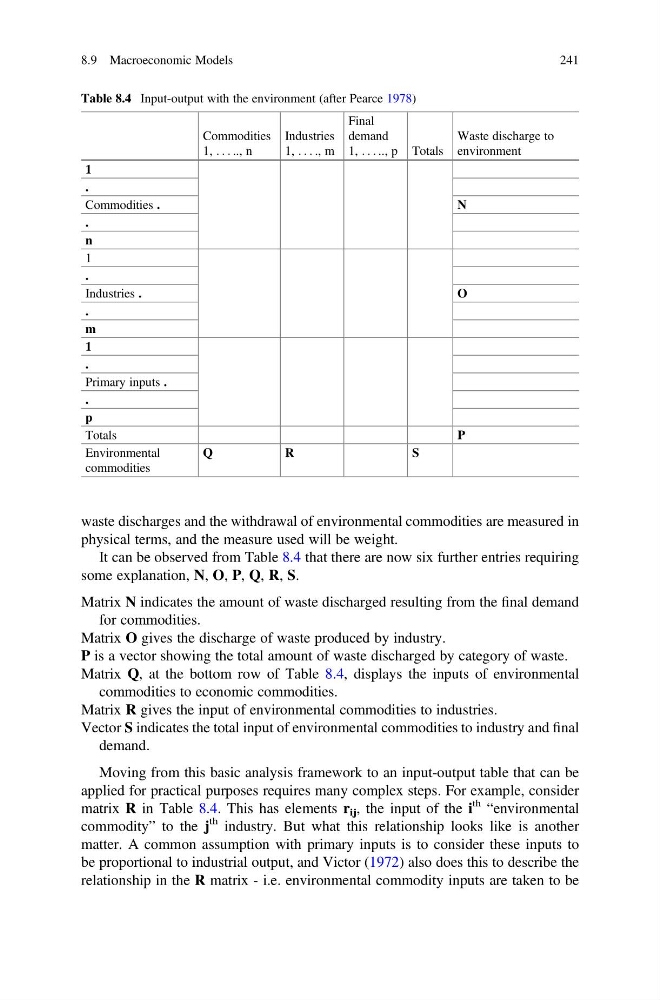
It can be observed from Table 8.4 that there are now six further entries requiring
some explanation, N, O, P, Q, R, S.
Matrix N indicates the amount of waste discharged resulting from the final demand
for commodities.
Matrix O gives the discharge of waste produced by industry.
P is a vector showing the total amount of waste discharged by category of waste.
Matrix Q, at the bottom row of Table 8.4, displays the inputs of environmental
commodities to economic commodities.
Matrix R gives the input of environmental commodities to industries.
Vector S indicates the total input of environmental commodities to industry and final
demand.
Moving from this basic analysis framework to an input-output table that can be
applied for practical purposes requires many complex steps. For example, consider
matrix R in Table 8.4. This has elements r ij , the input of the i
th “environmental
commodity” to the j
th industry. But what this relationship looks like is another
matter. A common assumption with primary inputs is to consider these inputs to
be proportional to industrial output, and Victor (1972) also does this to describe the
relationship in the R matrix - i.e. environmental commodity inputs are taken to be
Table 8.4 Input-output with the environment (after Pearce 1978)
Commodities
1, . . . .., n
Industries
1, . . . ., m
Final
demand
1, . . . .., p Totals
Waste discharge to
environment
1
.
Commodities .
N
.
n
1
.
Industries .
O
.
m
1
.
Primary inputs .
.
p
Totals
P
Environmental
commodities
Q
R
S
8.9 Macroeconomic Models
241
physical terms, and the measure used will be weight.
It can be observed from Table 8.4 that there are now six further entries requiring
some explanation, N, O, P, Q, R, S.
Matrix N indicates the amount of waste discharged resulting from the final demand
for commodities.
Matrix O gives the discharge of waste produced by industry.
P is a vector showing the total amount of waste discharged by category of waste.
Matrix Q, at the bottom row of Table 8.4, displays the inputs of environmental
commodities to economic commodities.
Matrix R gives the input of environmental commodities to industries.
Vector S indicates the total input of environmental commodities to industry and final
demand.
Moving from this basic analysis framework to an input-output table that can be
applied for practical purposes requires many complex steps. For example, consider
matrix R in Table 8.4. This has elements r ij , the input of the i
th “environmental
commodity” to the j
th industry. But what this relationship looks like is another
matter. A common assumption with primary inputs is to consider these inputs to
be proportional to industrial output, and Victor (1972) also does this to describe the
relationship in the R matrix - i.e. environmental commodity inputs are taken to be
Table 8.4 Input-output with the environment (after Pearce 1978)
Commodities
1, . . . .., n
Industries
1, . . . ., m
Final
demand
1, . . . .., p Totals
Waste discharge to
environment
1
.
Commodities .
N
.
n
1
.
Industries .
O
.
m
1
.
Primary inputs .
.
p
Totals
P
Environmental
commodities
Q
R
S
8.9 Macroeconomic Models
241