

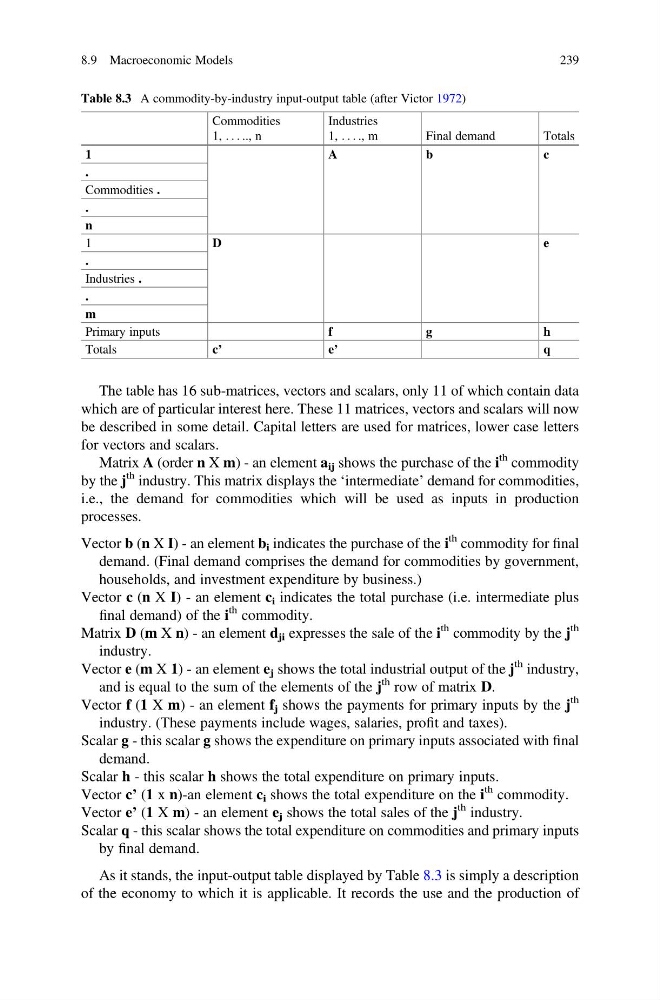
The table has 16 sub-matrices, vectors and scalars, only 11 of which contain data
which are of particular interest here. These 11 matrices, vectors and scalars will now
be described in some detail. Capital letters are used for matrices, lower case letters
for vectors and scalars.
Matrix A (order n X m) - an element a ij shows the purchase of the i
th commodity
by the j
th industry. This matrix displays the ‘intermediate’ demand for commodities,
i.e., the demand for commodities which will be used as inputs in production
processes.
Vector b (n X I) - an element b i indicates the purchase of the i
th commodity for final
demand. (Final demand comprises the demand for commodities by government,
households, and investment expenditure by business.)
Vector c (n X I) - an element c i indicates the total purchase (i.e. intermediate plus
final demand) of the i
th commodity.
Matrix D (m X n) - an element d ji expresses the sale of the i
th commodity by the j
th
industry.
Vector e (m X 1) - an element e j shows the total industrial output of the j
th industry,
and is equal to the sum of the elements of the j
th row of matrix D.
Vector f (1 X m) - an element f j shows the payments for primary inputs by the j
th
industry. (These payments include wages, salaries, profit and taxes).
Scalar g - this scalar g shows the expenditure on primary inputs associated with final
demand.
Scalar h - this scalar h shows the total expenditure on primary inputs.
Vector c’ (1 x n)-an element c i shows the total expenditure on the i
th commodity.
Vector e’ (1 X m) - an element e j shows the total sales of the j
th industry.
Scalar q - this scalar shows the total expenditure on commodities and primary inputs
by final demand.
As it stands, the input-output table displayed by Table 8.3 is simply a description
of the economy to which it is applicable. It records the use and the production of
Table 8.3 A commodity-by-industry input-output table (after Victor 1972)
Commodities
1, . . . .., n
Industries
1, . . . ., m
Final demand
Totals
1
A
b
c
.
Commodities .
.
n
1
D
e
.
Industries .
.
m
Primary inputs
f
g
h
Totals
c’
e’
q
8.9 Macroeconomic Models
239
which are of particular interest here. These 11 matrices, vectors and scalars will now
be described in some detail. Capital letters are used for matrices, lower case letters
for vectors and scalars.
Matrix A (order n X m) - an element a ij shows the purchase of the i
th commodity
by the j
th industry. This matrix displays the ‘intermediate’ demand for commodities,
i.e., the demand for commodities which will be used as inputs in production
processes.
Vector b (n X I) - an element b i indicates the purchase of the i
th commodity for final
demand. (Final demand comprises the demand for commodities by government,
households, and investment expenditure by business.)
Vector c (n X I) - an element c i indicates the total purchase (i.e. intermediate plus
final demand) of the i
th commodity.
Matrix D (m X n) - an element d ji expresses the sale of the i
th commodity by the j
th
industry.
Vector e (m X 1) - an element e j shows the total industrial output of the j
th industry,
and is equal to the sum of the elements of the j
th row of matrix D.
Vector f (1 X m) - an element f j shows the payments for primary inputs by the j
th
industry. (These payments include wages, salaries, profit and taxes).
Scalar g - this scalar g shows the expenditure on primary inputs associated with final
demand.
Scalar h - this scalar h shows the total expenditure on primary inputs.
Vector c’ (1 x n)-an element c i shows the total expenditure on the i
th commodity.
Vector e’ (1 X m) - an element e j shows the total sales of the j
th industry.
Scalar q - this scalar shows the total expenditure on commodities and primary inputs
by final demand.
As it stands, the input-output table displayed by Table 8.3 is simply a description
of the economy to which it is applicable. It records the use and the production of
Table 8.3 A commodity-by-industry input-output table (after Victor 1972)
Commodities
1, . . . .., n
Industries
1, . . . ., m
Final demand
Totals
1
A
b
c
.
Commodities .
.
n
1
D
e
.
Industries .
.
m
Primary inputs
f
g
h
Totals
c’
e’
q
8.9 Macroeconomic Models
239