

from a rate variable. Since information links always finally terminate at rates, rate-torate coupling is not permissible.
Information flows perform the vital role of linking the physical flows. For
example, the flow of order for capacity increase may depend on information relating
to capacity on hand (in the flow of capacity), order backlog (in the flow of requisition), and inventory (in the flow of material); and material requisition rate may
depend on inventory on hand (in the flow of materials), inventory on order (in the
flow of orders and material) and on cash at hand (in the flow of cash). Thus, physical
flows are separate and isolated without the information flows.
6.5.4 Flow Diagrams
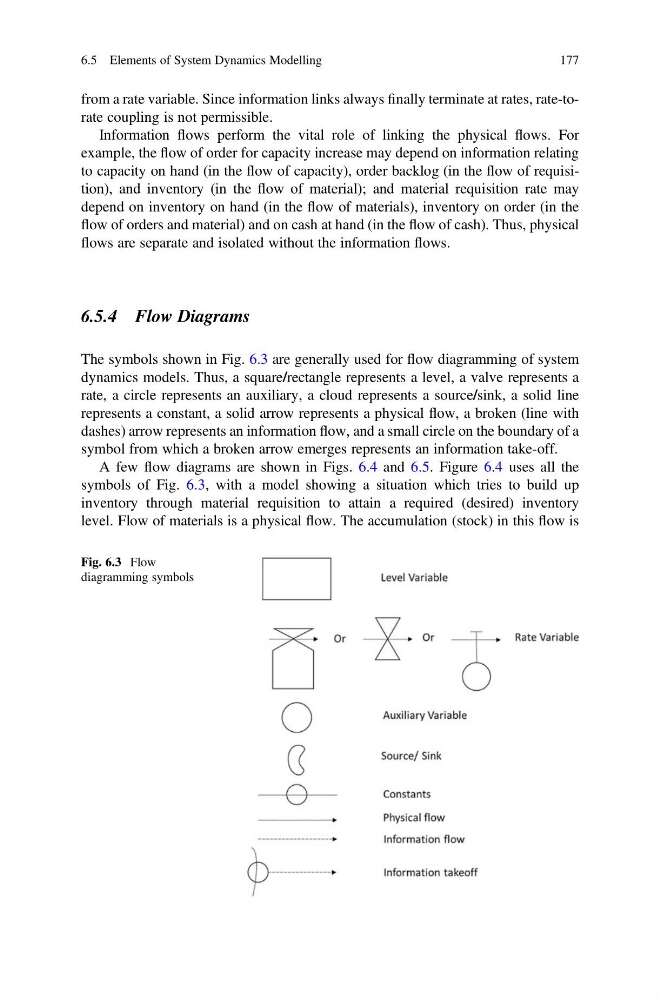
The symbols shown in Fig. 6.3 are generally used for flow diagramming of system
dynamics models. Thus, a square/rectangle represents a level, a valve represents a
rate, a circle represents an auxiliary, a cloud represents a source/sink, a solid line
represents a constant, a solid arrow represents a physical flow, a broken (line with
dashes) arrow represents an information flow, and a small circle on the boundary of a
symbol from which a broken arrow emerges represents an information take-off.
A few flow diagrams are shown in Figs. 6.4 and 6.5. Figure 6.4 uses all the
symbols of Fig. 6.3, with a model showing a situation which tries to build up
inventory through material requisition to attain a required (desired) inventory
level. Flow of materials is a physical flow. The accumulation (stock) in this flow is
Fig. 6.3 Flow
diagramming symbols
6.5 Elements of System Dynamics Modelling
177
Information flows perform the vital role of linking the physical flows. For
example, the flow of order for capacity increase may depend on information relating
to capacity on hand (in the flow of capacity), order backlog (in the flow of requisition), and inventory (in the flow of material); and material requisition rate may
depend on inventory on hand (in the flow of materials), inventory on order (in the
flow of orders and material) and on cash at hand (in the flow of cash). Thus, physical
flows are separate and isolated without the information flows.
6.5.4 Flow Diagrams
The symbols shown in Fig. 6.3 are generally used for flow diagramming of system
dynamics models. Thus, a square/rectangle represents a level, a valve represents a
rate, a circle represents an auxiliary, a cloud represents a source/sink, a solid line
represents a constant, a solid arrow represents a physical flow, a broken (line with
dashes) arrow represents an information flow, and a small circle on the boundary of a
symbol from which a broken arrow emerges represents an information take-off.
A few flow diagrams are shown in Figs. 6.4 and 6.5. Figure 6.4 uses all the
symbols of Fig. 6.3, with a model showing a situation which tries to build up
inventory through material requisition to attain a required (desired) inventory
level. Flow of materials is a physical flow. The accumulation (stock) in this flow is
Fig. 6.3 Flow
diagramming symbols
6.5 Elements of System Dynamics Modelling
177