

322
S. Nowak
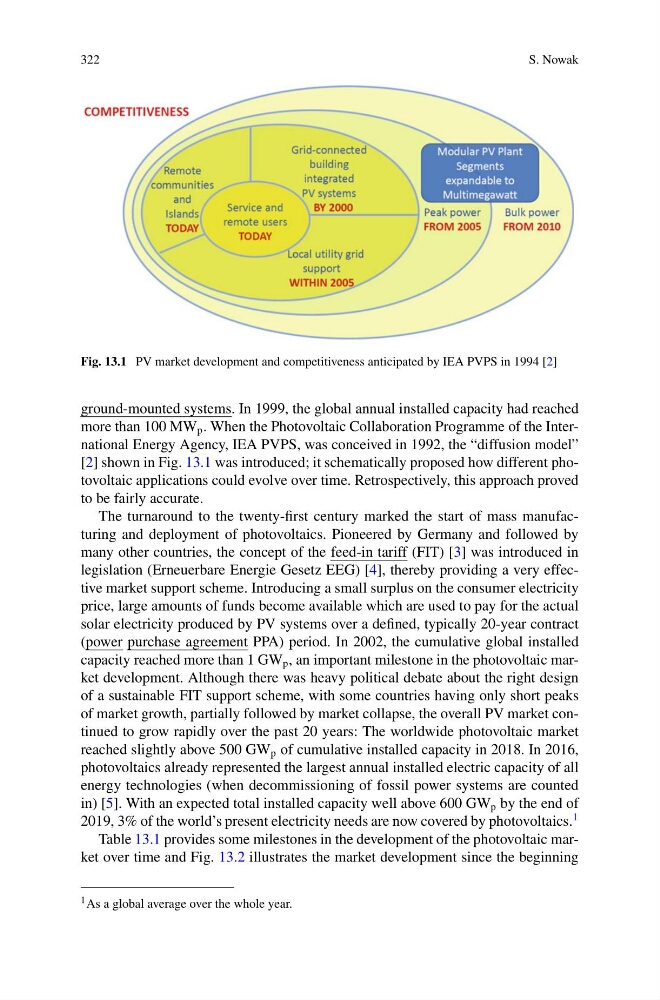
Fig. 13.1 PV market development and competitiveness anticipated by IEA PVPS in 1994 [2]
ground-mounted systems. In 1999, the global annual installed capacity had reached
more than 100 MW p . When the Photovoltaic Collaboration Programme of the International Energy Agency, IEA PVPS, was conceived in 1992, the “diffusion model”
[2] shown in Fig. 13.1 was introduced; it schematically proposed how different photovoltaic applications could evolve over time. Retrospectively, this approach proved
to be fairly accurate.
The turnaround to the twenty-first century marked the start of mass manufacturing and deployment of photovoltaics. Pioneered by Germany and followed by
many other countries, the concept of the feed-in tariff (FIT) [3] was introduced in
legislation (Erneuerbare Energie Gesetz EEG) [4], thereby providing a very effective market support scheme. Introducing a small surplus on the consumer electricity
price, large amounts of funds become available which are used to pay for the actual
solar electricity produced by PV systems over a defined, typically 20-year contract
(power purchase agreement PPA) period. In 2002, the cumulative global installed
capacity reached more than 1 GW p , an important milestone in the photovoltaic market development. Although there was heavy political debate about the right design
of a sustainable FIT support scheme, with some countries having only short peaks
of market growth, partially followed by market collapse, the overall PV market continued to grow rapidly over the past 20 years: The worldwide photovoltaic market
reached slightly above 500 GW p of cumulative installed capacity in 2018. In 2016,
photovoltaics already represented the largest annual installed electric capacity of all
energy technologies (when decommissioning of fossil power systems are counted
in) [5]. With an expected total installed capacity well above 600 GW p by the end of
2019, 3% of the world’s present electricity needs are now covered by photovoltaics.
1
Table 13.1 provides some milestones in the development of the photovoltaic market over time and Fig. 13.2 illustrates the market development since the beginning
1 As a global average over the whole year.
S. Nowak
Fig. 13.1 PV market development and competitiveness anticipated by IEA PVPS in 1994 [2]
ground-mounted systems. In 1999, the global annual installed capacity had reached
more than 100 MW p . When the Photovoltaic Collaboration Programme of the International Energy Agency, IEA PVPS, was conceived in 1992, the “diffusion model”
[2] shown in Fig. 13.1 was introduced; it schematically proposed how different photovoltaic applications could evolve over time. Retrospectively, this approach proved
to be fairly accurate.
The turnaround to the twenty-first century marked the start of mass manufacturing and deployment of photovoltaics. Pioneered by Germany and followed by
many other countries, the concept of the feed-in tariff (FIT) [3] was introduced in
legislation (Erneuerbare Energie Gesetz EEG) [4], thereby providing a very effective market support scheme. Introducing a small surplus on the consumer electricity
price, large amounts of funds become available which are used to pay for the actual
solar electricity produced by PV systems over a defined, typically 20-year contract
(power purchase agreement PPA) period. In 2002, the cumulative global installed
capacity reached more than 1 GW p , an important milestone in the photovoltaic market development. Although there was heavy political debate about the right design
of a sustainable FIT support scheme, with some countries having only short peaks
of market growth, partially followed by market collapse, the overall PV market continued to grow rapidly over the past 20 years: The worldwide photovoltaic market
reached slightly above 500 GW p of cumulative installed capacity in 2018. In 2016,
photovoltaics already represented the largest annual installed electric capacity of all
energy technologies (when decommissioning of fossil power systems are counted
in) [5]. With an expected total installed capacity well above 600 GW p by the end of
2019, 3% of the world’s present electricity needs are now covered by photovoltaics.
1
Table 13.1 provides some milestones in the development of the photovoltaic market over time and Fig. 13.2 illustrates the market development since the beginning
1 As a global average over the whole year.