

376
20 Wonders of Multifield Lattice Oscillation
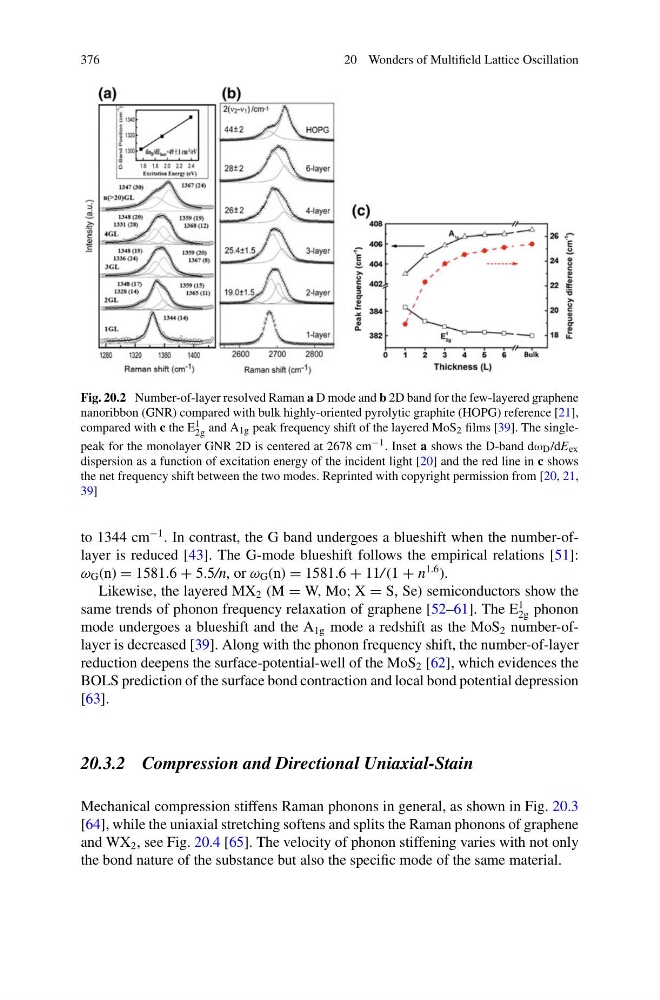
Fig. 20.2 Number-of-layer resolved Raman a D mode and b 2D band for the few-layered graphene
nanoribbon (GNR) compared with bulk highly-oriented pyrolytic graphite (HOPG) reference [21],
compared with c the E 1
2g and A 1g peak frequency shift of the layered MoS 2 films [39]. The singlepeak for the monolayer GNR 2D is centered at 2678 cm −1 . Inset a shows the D-band dω D /dE ex
dispersion as a function of excitation energy of the incident light [20] and the red line in c shows
the net frequency shift between the two modes. Reprinted with copyright permission from [20, 21,
39]
to 1344 cm
−1 . In contrast, the G band undergoes a blueshift when the number-oflayer is reduced [43]. The G-mode blueshift follows the empirical relations [51]:
ω G (n) = 1581.6 + 5.5/n, or ω G (n) = 1581.6 + 11/ (1 + n
1.6 ).
Likewise, the layered MX 2 (M = W, Mo; X = S, Se) semiconductors show the
same trends of phonon frequency relaxation of graphene [52–61]. The E
1
2g phonon
mode undergoes a blueshift and the A 1g mode a redshift as the MoS 2 number-oflayer is decreased [39]. Along with the phonon frequency shift, the number-of-layer
reduction deepens the surface-potential-well of the MoS 2 [62], which evidences the
BOLS prediction of the surface bond contraction and local bond potential depression
[63].
20.3.2 Compression and Directional Uniaxial-Stain
Mechanical compression stiffens Raman phonons in general, as shown in Fig. 20.3
[64], while the uniaxial stretching softens and splits the Raman phonons of graphene
and WX 2 , see Fig. 20.4 [65]. The velocity of phonon stiffening varies with not only
the bond nature of the substance but also the specific mode of the same material.
20 Wonders of Multifield Lattice Oscillation
Fig. 20.2 Number-of-layer resolved Raman a D mode and b 2D band for the few-layered graphene
nanoribbon (GNR) compared with bulk highly-oriented pyrolytic graphite (HOPG) reference [21],
compared with c the E 1
2g and A 1g peak frequency shift of the layered MoS 2 films [39]. The singlepeak for the monolayer GNR 2D is centered at 2678 cm −1 . Inset a shows the D-band dω D /dE ex
dispersion as a function of excitation energy of the incident light [20] and the red line in c shows
the net frequency shift between the two modes. Reprinted with copyright permission from [20, 21,
39]
to 1344 cm
−1 . In contrast, the G band undergoes a blueshift when the number-oflayer is reduced [43]. The G-mode blueshift follows the empirical relations [51]:
ω G (n) = 1581.6 + 5.5/n, or ω G (n) = 1581.6 + 11/ (1 + n
1.6 ).
Likewise, the layered MX 2 (M = W, Mo; X = S, Se) semiconductors show the
same trends of phonon frequency relaxation of graphene [52–61]. The E
1
2g phonon
mode undergoes a blueshift and the A 1g mode a redshift as the MoS 2 number-oflayer is decreased [39]. Along with the phonon frequency shift, the number-of-layer
reduction deepens the surface-potential-well of the MoS 2 [62], which evidences the
BOLS prediction of the surface bond contraction and local bond potential depression
[63].
20.3.2 Compression and Directional Uniaxial-Stain
Mechanical compression stiffens Raman phonons in general, as shown in Fig. 20.3
[64], while the uniaxial stretching softens and splits the Raman phonons of graphene
and WX 2 , see Fig. 20.4 [65]. The velocity of phonon stiffening varies with not only
the bond nature of the substance but also the specific mode of the same material.